Chromebooks are simple, speedy, and flat-out effective in various capacities, whether browsing the wide interweb or downloading and installing the best Google Play Store apps. When you use ChromeOS consistently, you’ll find it meaningless to monitor it for varying performance levels since the operating system rarely bogs down.
With that said, some Chromebooks begin to show signs of old age, especially when they start nearing their Auto Update Expiration (AUE) date. Either that or if you’re simply concerned about your device’s performance, feel free to monitor it using the different methods we’ve outlined.
Keep on reading, therefore, to effectively learn how to monitor system performance on a Chromebook. Make sure to go through all included methods for the best results.
- Recommended read: How to sideload Android apps on Chromebook without Developer Mode.
Best ways to monitor system performance on a Chromebook
The following is our round-up of the best possible ways to analyze your Chromebook’s system performance. Since there is more than one method to accomplish the task at hand, we’ll be breaking the proper methods into different sections for better readability.
Option #1. Use Chrome’s built-in “System Internals” page
Before venturing into anything else, we’ll dive into one of Chrome’s well-established built-in functions. The developers have a web page in Google Chrome that allows users to analyze their system’s performance.
As a matter of fact, out of the many different URLs that Chrome comprises, such as “chrome://flags” and “chrome://about,” what we’re talking about here is a particular Chrome URL. Fortunately, the “chrome://sys-internals” Chrome URL is here to the rescue, allowing concerned individuals to determine their Chromebook’s performance.
Copy the following and paste it into the address bar of your Chrome’s URL bar and press the “Enter” key. You should be taken to the dedicated “System Internals” page in no more than a moment. As soon as you do, the following image will represent the first thing you’ll visualize on your Chromebook’s screen.
chrome://sys-internals

The “System Internals” page on Google Chrome
As you can comprehend from the screenshot above, System Internals is a Chrome URL where you can access the performance statistics of your device. Everything from the number of cores and your CPU usage to your total RAM availability and its current occupation, this is the place you go to for monitoring your Chromebook’s vitals.
When you’re done checking out the various parameters that the main System Internals page offers, you can go ahead and click on the “More” icon in the top-left corner of the screen, symbolized by three horizontal lines placed together in close proximity. Selecting it should reveal further options on the screen for you.
Let’s take a look at what they are in the following screenshot. We’ve got CPU, Memory, and Zram to probe further since we’re already in the main “Info” section.
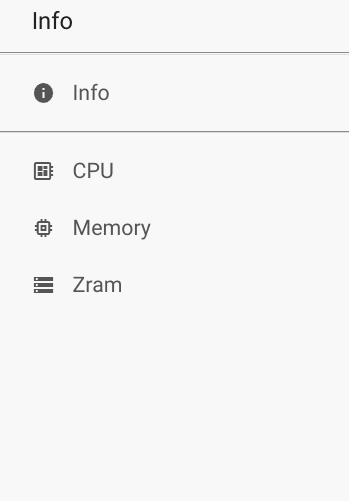
Various performance parameters on the System Internals page
CPU
CPU
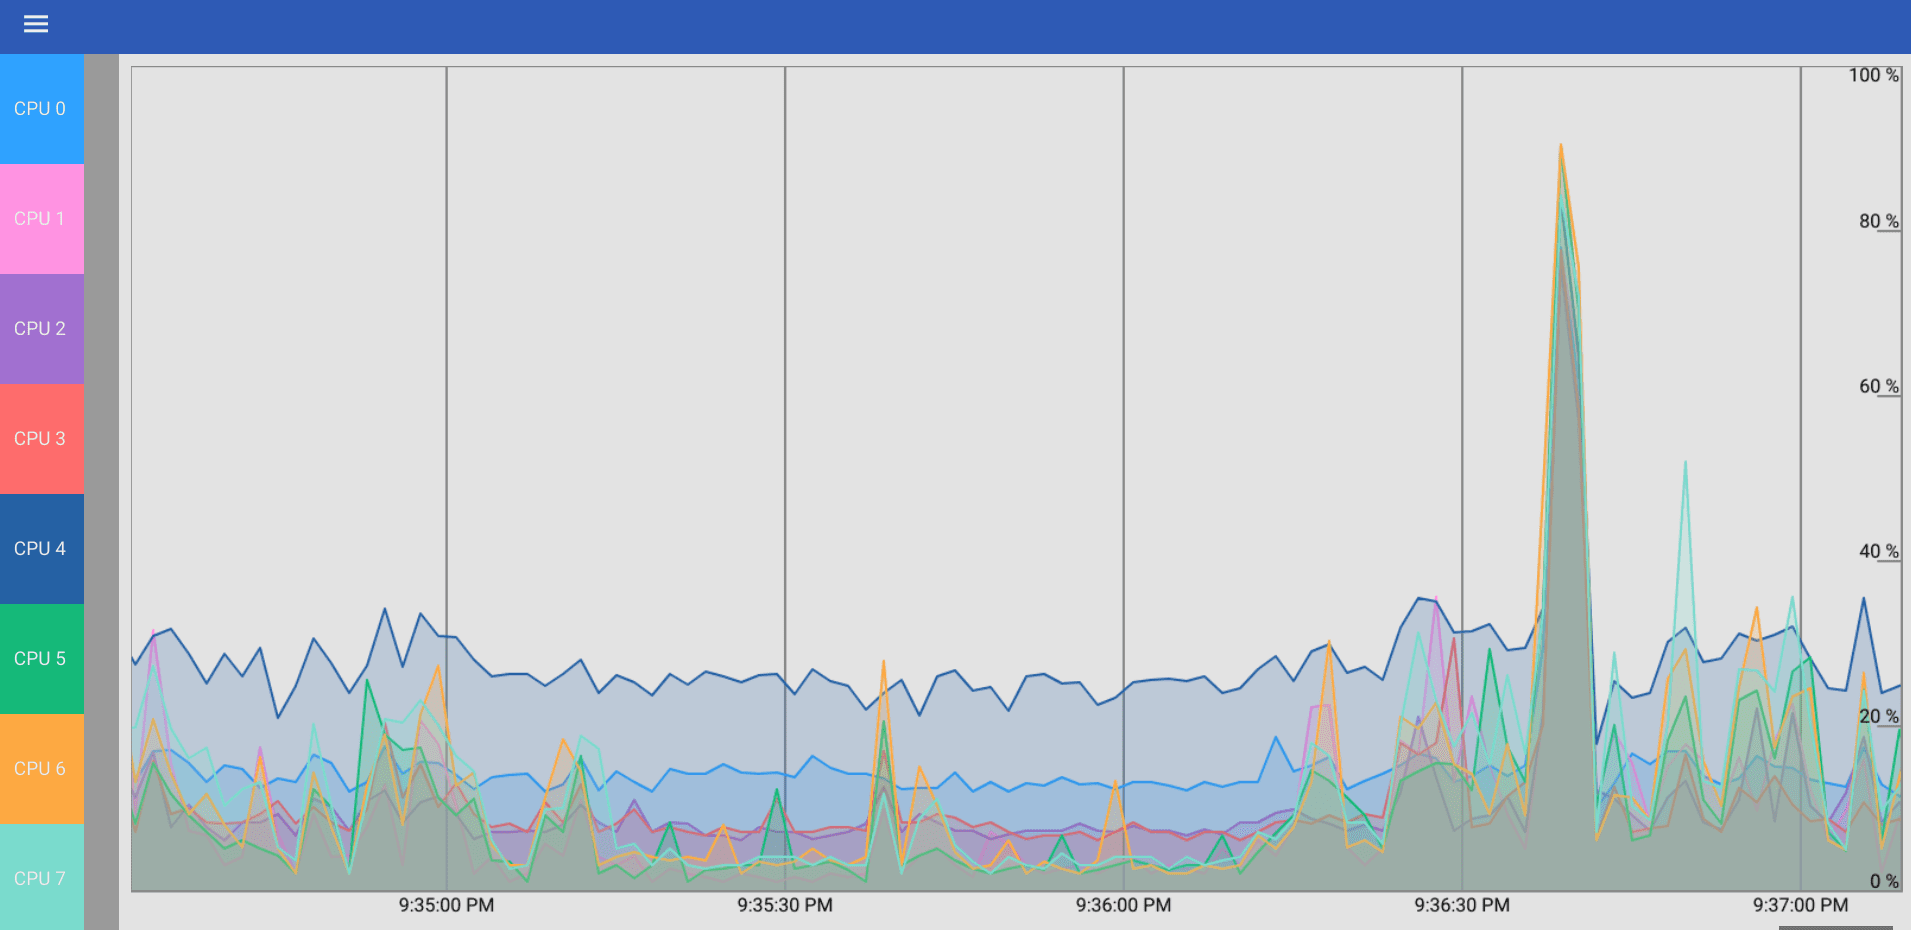
First off, we’ve got the CPU section to look forward to. You’ll observe that within each of these parameters, whether CPU, Memory, or Zram, Chrome has presented a graphical illustration of your device’s performance. Depending on your multi-threaded core CPU, you’ll see a specific number of processor charts within this section.
You can toggle on and off each line to pinpoint a specific processor. This will be done by clicking on the colored CPU blocks on the left-hand side of the screen. The chart line will either appear or disappear after clicking on the relevant color-coded CPU thread. Try it on your end, and let us know how it goes.
The best part is that the chart shows you real-time updates with each passing second, and you can also zoom in and zoom out for a more detailed view of the ups and downs in the chart or just a quick look-through of the overall graph.
Memory
Memory
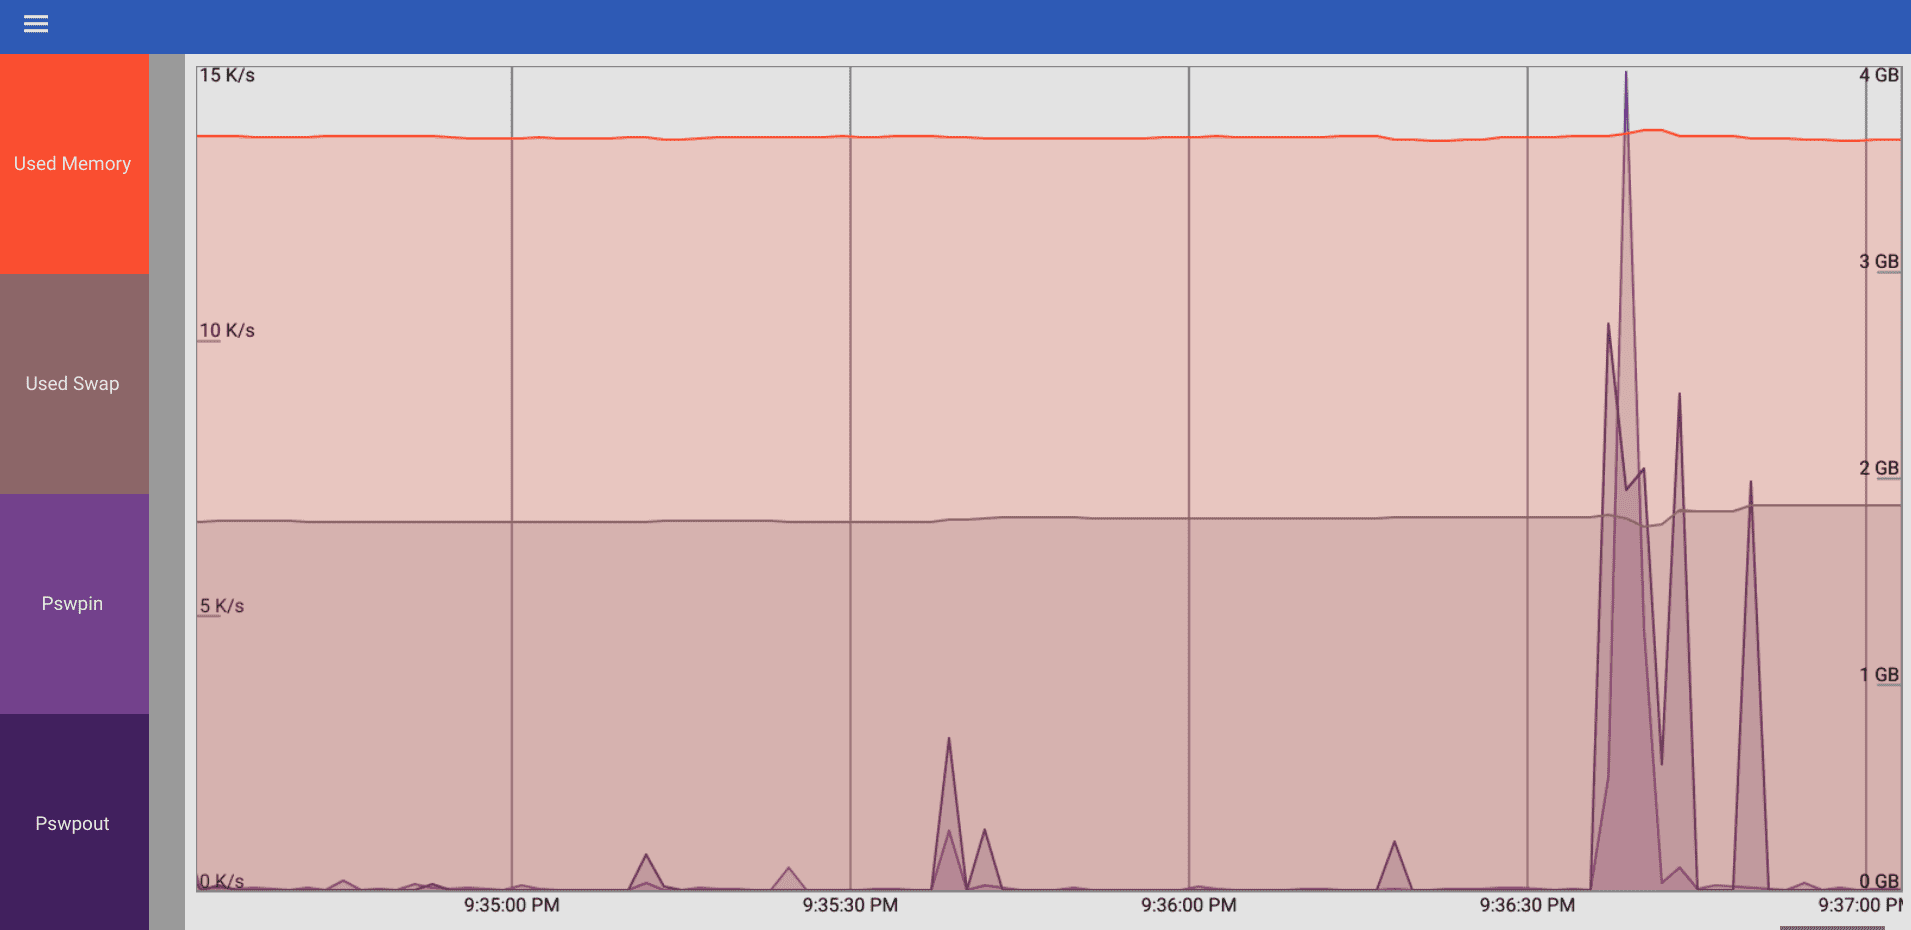
Next up, we’ve got the “Memory” portion of your Chromebook’s performance to delve into. Although there are multiple ways of checking RAM on your Chromebook, the System Internals Chrome URL page has proven to be equally effective, quickly displaying all the various memory-centric parameters your Chromebook comprises.
Out of the available options, you’ve got “Used Memory,” “Used Swap,” “Pswpin,” and “Pswpout” to check out in the “Memory” section of the System Internals page. Like the “CPU” sector, you can zoom in to take a close-up look at the charts or zoom out if you wish to make haste.
Internal memory, or RAM, is essential for a Chromebook to perform at its best. If you’re out in the market trying to get a new Chromebook, you should be aware of the ideal RAM size you’ll need for ChromeOS.
However, if you already have adequate RAM on your device but have a hard time managing it, here are some of the best ways you can use to free up RAM on a Chromebook.
Zram
Zram
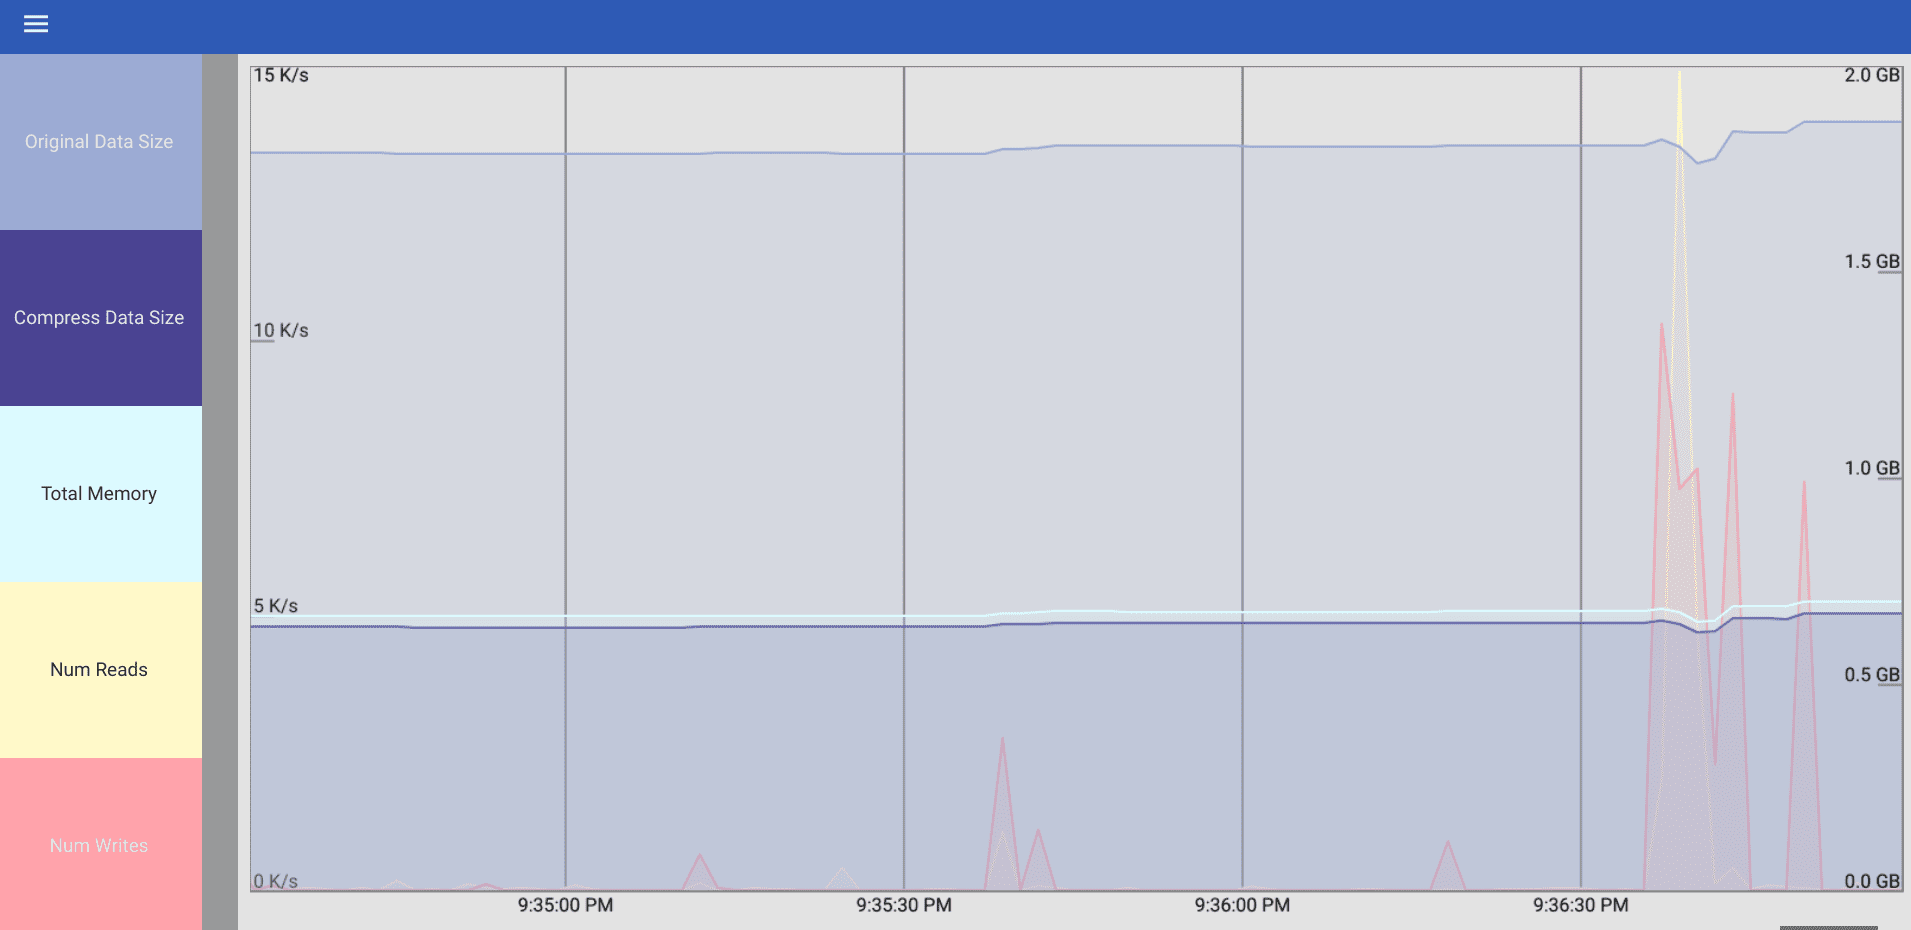
Lastly, we’ve got the “Zram” section to talk about. Not many casuals would know this parameter before prior research, given its lesser-known stature. Zram’s alternative name is “compcache,” a Linux kernel module specific to Android operating systems.
Its sole purpose is to formulate a highly particular compressed block device in the memory section of the device, precisely one that features on-the-fly compression of the presently available disk. The available options that you can perceive on this front include “Original Data Size,” “Compress Data Size,” “Total Memory,” “Num Reads,” and “Num Writes.”
Option #2. Use Chrome’s Task Manager
Although the first option we have above is quite effective in monitoring your Chromebook’s performance, it’s not all we have on ChromeOS. There’s the Google Chrome Task Manager to turn our attention to, and it’s quite a convenient tool at your disposal.
Although we’ve already written a complete guide on how to use Chrome’s Task Manager in the best possible manner that you should check out, we’re still going to talk you through the necessary details in this subsection. First, you must learn how to open the web browser’s in-built Task Manager.
An easy way to get that done is by relying on the shortcut key combination of “Search” and “Esc.” After pressing these two keys together, the Task Manager window will pop up on the screen and will look something like the following.
As you can comprehend, Google Chrome’s Task Manager enlists all the different processes running in the background and foreground on your Chromebook and lets you visualize the system resources in use for them. Major parameters such as “Memory footprint” and “CPU” appear in the Task Manager and allow you to take a quick look at them.
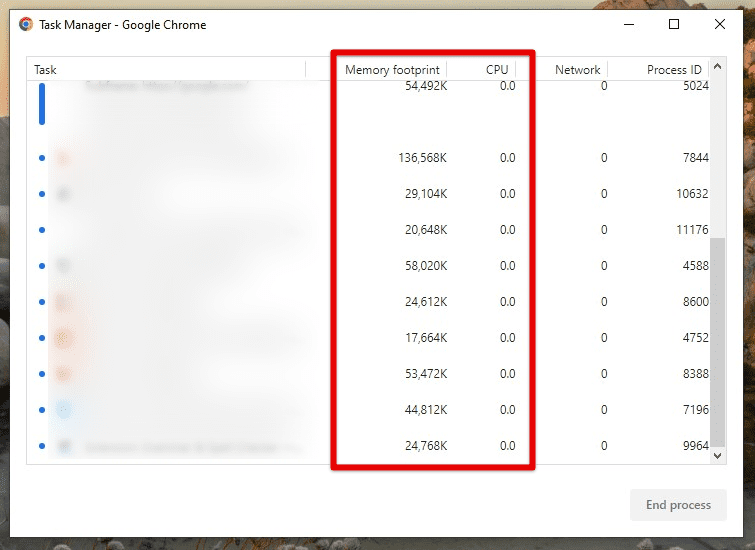
Google Chrome’s Task Manager
The best part is that this helpful tool doesn’t let you view your Chromebook’s performance levels; managing things also kicks into effect. This puts the “Manager” in Task Manager—no doubt about that. If a running app is hoarding a lot of RAM or CPU usage, feel free to select it once and click on “End process.”
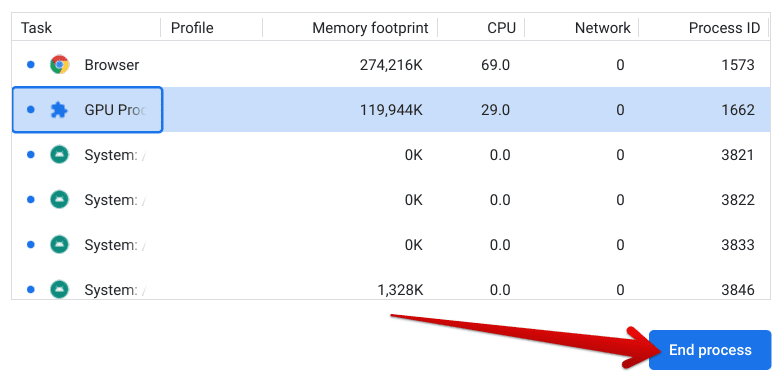
Ending a process in the Chrome Task Manager
With the second primary method of monitoring your Chromebook’s performance out of the way, let’s talk about the third and final way you can check how well your device is doing its job. This one’s a relatively quicker way of accomplishing the task in question.
Option #3. Download and install a dedicated Chrome extension
Last but not least, we’ve got a Chrome Web Store extension to answer our query. It’s fortunate but typical of the famous Google Chrome add-on storefront, given how we’ve got dozens of high-rated Chrome extensions to install and use. We’ll look at Cog – System Info Viewer to monitor your Chromebook’s performance.
Featuring more than 200,000 active users with a 4.5/5.0 overall rating, Cog is responsible for displaying much important hardware information, including system performance metrics, such as CPU and memory. We’ll show you how to download the extension on your Chromebook so you can follow through with it effectively.
1. The first step is to head over to the official Cog – System Info Viewer extension page on the Chrome Web Store page. Once you’re there, click on the “Add to Chrome” button to proceed.

Adding Cog to Chrome
2. Right after that, a prompt will appear from the top of the page, asking you to confirm your selection. Click on “Add app,” and you’ll be done.
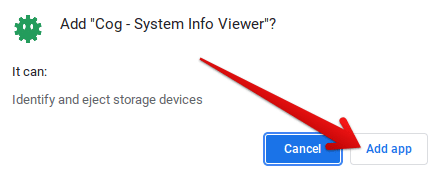
Confirming the installation of Cog
3. Cog will be installed on your Chromebook shortly after the previous step. First, check your Chromebook launcher section for the installed app. The application’s icon should look identical to what you see in the screenshot below.
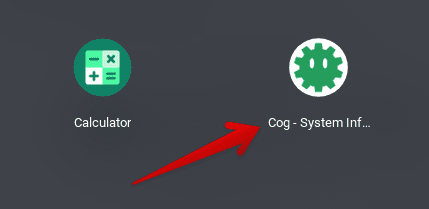
Cog – System Info Viewer installed
After locating the app, click on it, so the tool launches promptly on your end. The moment the application’s window appears on the screen, you’ll observe the following. From the same operating system you’re running to Chrome’s version, CPU architecture, and CPU usage, Cog is the application for a relatively detailed analysis of your device’s performance.
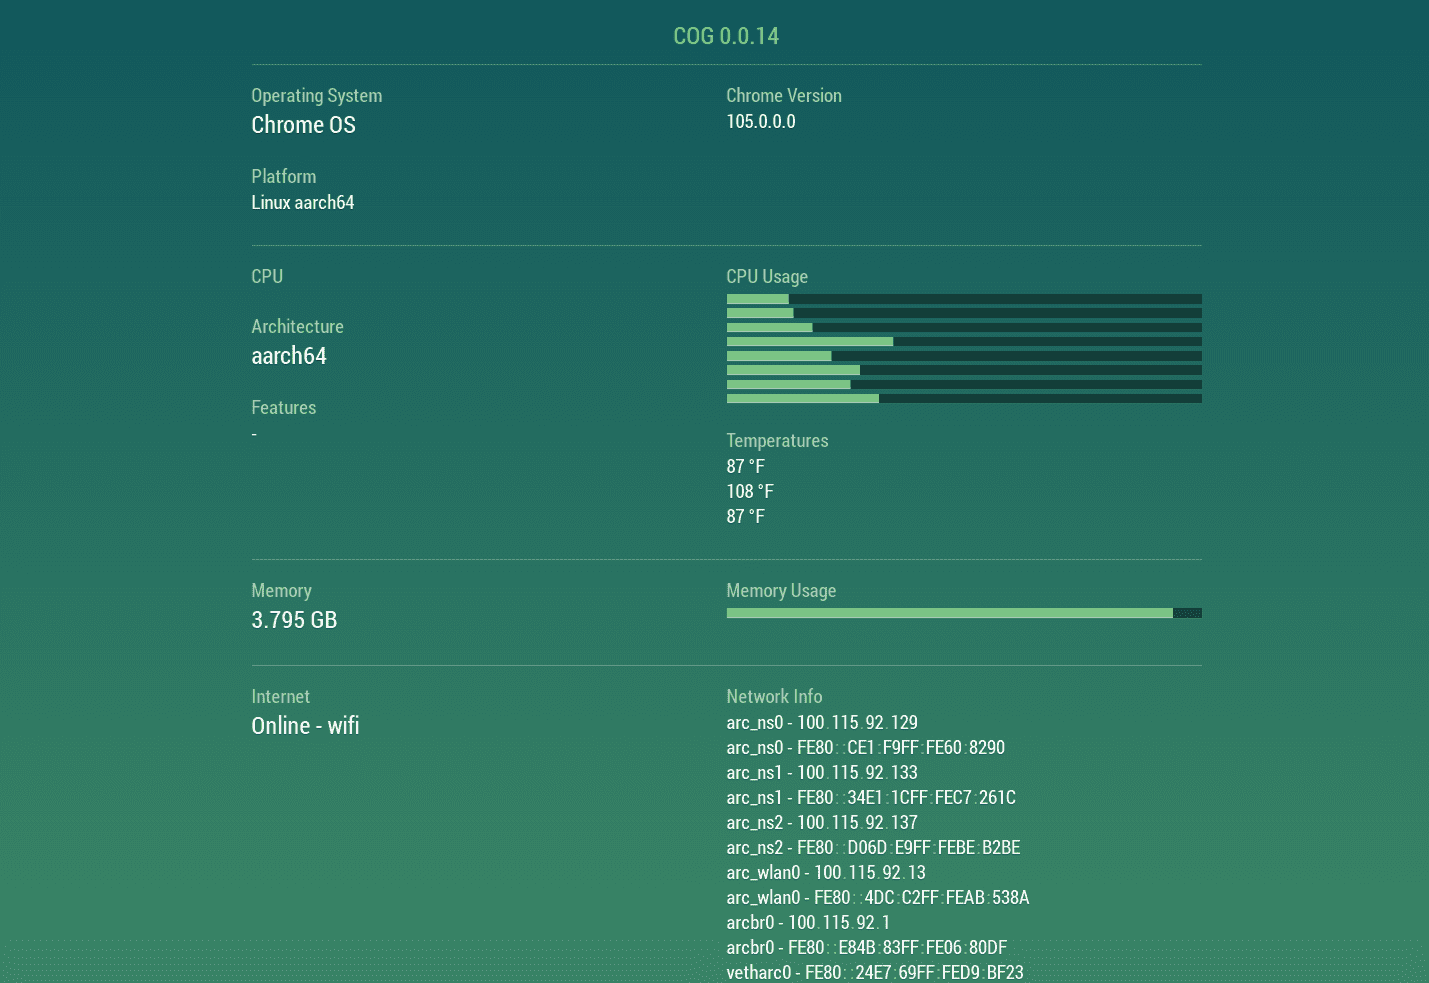
Cog in action
To highlight the CPU usage, in particular, this is the section you have to concern yourself with if you’re after your device’s performance and just that. You can observe the levels going back and forth as you fire up more and more apps on the Chromebook and let the CPU go to work.
That’s about it! Now that you’ve read through three primary ways of monitoring your Chromebook’s performance, we’re comfortable that you’ll be able to hold your own relatively painlessly moving forward.
Conclusion
Chromebooks have some of the most polished operating systems that allow them to excel in various aspects of the modern computing world. Contrary to the niche belief of many, ChromeOS is capable of running WordPress, Kali Linux, and tons of other high-quality software such as LumaFusion and Lightworks.
In this guide, we’ve talked about easy-to-grasp techniques for monitoring your Chromebook’s system performance daily. All of the methods above can be used to enjoy desirable results. Do let us know in the comments section ahead whether you found this helpful guide for your cause. As always, Chrome Ready wishes you good luck!
- Before you go: The 5 best Chromebooks for Linux in 2022.
