Google Chrome is a world-famous internet browser recognized proficiently for its comprehensive feature set and universal compatibility with apps and processes. Apart from all the different tools and functionalities that Chrome sports right off the bat, one may prove to be of significant interest to a dedicated user base—the “Developer tools” section, which essentially opens up the Google Chrome developer console.
In this comprehensive guide, we’ll go over the idea of Chrome’s dev tools built right into the browser for seamless access. The write-up will cover the various use cases of the developer console for both devs and non-devs. Given the efficacy of the features present on that front, the “Developer tools” area can be utilized by different people for multiple purposes. Let’s go into more detail about all of this ahead.
What is Chrome’s developer console?
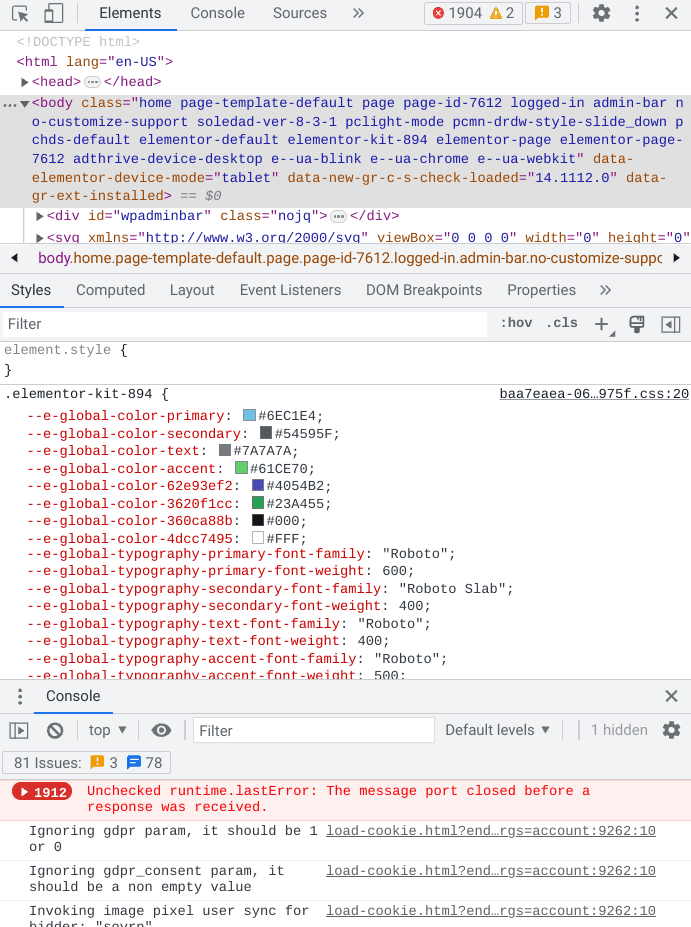
What the Chrome DevTools section looks like on Chrome
The Chrome browser has multiple features and tools to accommodate users of all sorts. While you’ll find the Chrome Web Store offering its diverse range of services in the form of browser extensions to facilitate the base user experience of Chrome, there’s something else of a far more powerful nature that’s built right into Google Chrome—the developer console.
Your Chrome browser’s developer console is a section within the internet surfer that can be accessed in numerous ways. It comprises multiple tools, fundamentally known as Chrome DevTools, that let you make on-page tweaks, both from a developer’s perspective and a regular end user, not to mention the added expanse of debugging and profiling features. With that said, some may find getting into the developer console a little tricky, given the learning curve present.
Putting it simply, the collective function of the Chrome DevTools section is based on making adjustments to particular web pages in different ways. In the wake of that, you are better capable of digging out issues with your site if you’re a developer without having to hit up the back end. That’s the major advantage of DevTools in Chrome.
Since the developer console lets you pinpoint the code primarily concerning a specific viewpoint on a page, it’s no longer required to go through the hassle of making semi-permanent changes from the administrative end. With the help of the developer console, you can make changes right there and then, letting you preview your web pages for seamless productivity.
That’s just the gist of it. We’ll now check out how you can access the developer console in Google Chrome since there are many ways to go about it here.
How do you access the developer console in Google Chrome?
The Chrome DevTools section of the Chrome browser can be accessed in various ways. We’ll detail them all in this section, so you know your options and can proceed accordingly. Primarily, the easiest way to open the developer console is by using the shortcut key combination of “Ctrl,” “Shift,” and “J” if you’re on Windows. Using “Ctrl,” “Alt,” and “I” also works and takes you to a different section of the DevTools feature.
Pressing the F12 key on Windows is another quick way of jumping right into the latter, but this only works for default settings where you haven’t mapped your keys to perform other functions. For those who are using a Mac, you may press the “Command,” “Shift,” and “C” keys on your keyboard to fire up the developer console section while browsing a page in Chrome. In case you’d like to launch a specific portion in DevTools, press the “Command,” “Shift,” and “J” keys.
Apart from the shortcut keys that allow you to get into the developer console, a more manual approach can be taken here. Click the “Customize and control Google Chrome” button and hover the cursor over the “More tools” button. Once done, new options will appear on your end, revealing the “Developer tools” feature. Choose it, and positive results will follow.
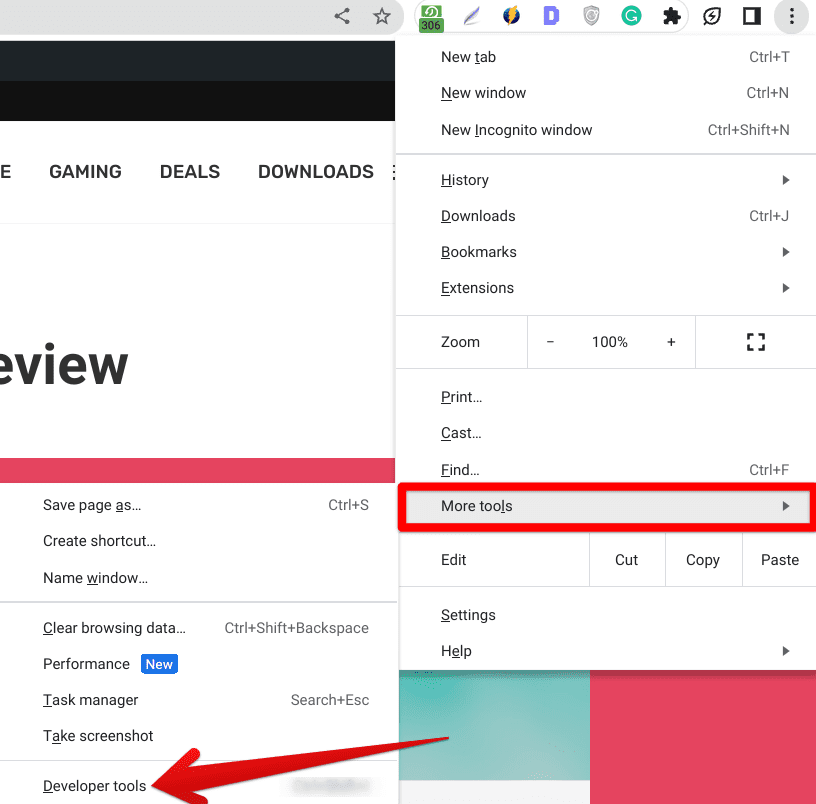
Opening DevTools in Google Chrome
With that out of the way, there’s one final way you can open DevTools in Chrome, and it’s pretty painless to follow through with. Right-click anywhere on the screen when a web page is opened to make the relevant options pop up. Once done, choose “Inspect” as in “Inspect element,” which should work like a charm. That’s about it. The latter is the best way to acquire ready access to DevTools in Chrome, especially the shortcut keys.
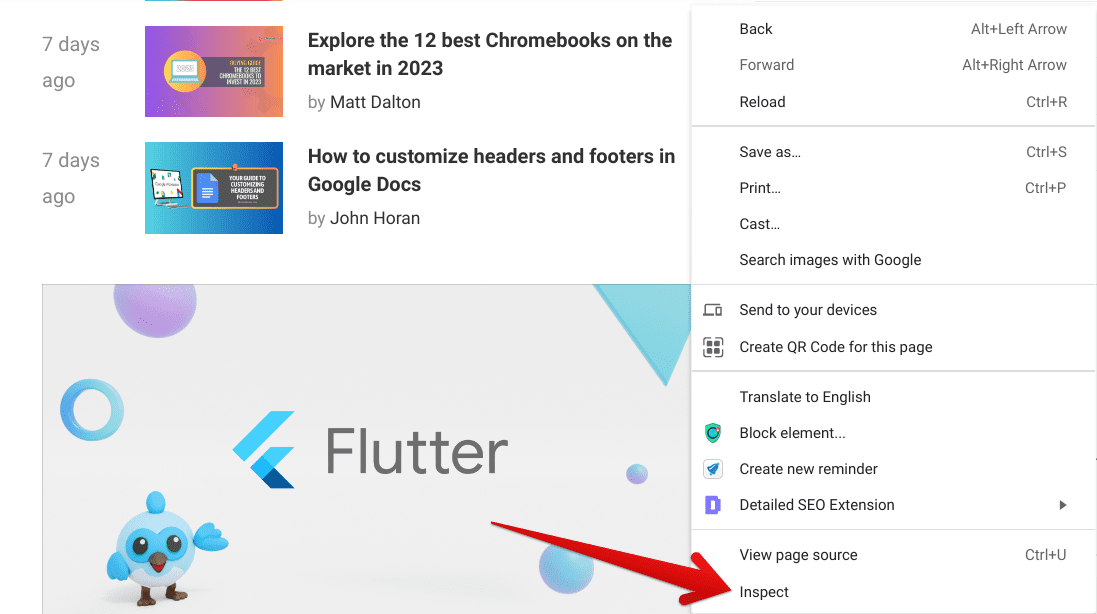
Another way to open the developer console in Chrome
- Please note that there’s no native way to access the developer console in the Android version of Google Chrome.
What are the various features of Chrome DevTools?
Now, the Chrome DevTools section is expansive, so it’s certainly worth diving into its various features and tools to better understand the functionality at hand. After popping open the developer console with any of the methods explained above, you’ll notice that a side panel will surface on the right of the opened page in Chrome, taking up space and allowing you to work with the best developer tools the browser offers. You may as well also resize the panel.
Given its complexity, your first few glances at the developer console will be daunting. However, we assure you that things are not as scary as they look on this side of the browser. Moreover, the following breakdown of the major parts and features of DevTools will also greatly help increase your program’s usability. Therefore, let’s start with the most fundamental portion of the developer console—the “Elements” tab.
This particular portion is what beginners familiarize themselves with first before venturing into the advanced mechanics of the DevTools feature in Chrome. The “Elements” portion involves digging up errors, bugs, and other site-related issues on a specific page. Its rudimentary focus is to let users edit the HTML and CSS on the front end, thereby making temporary edits to the page without any permanent application. Pretty safe, helpful, and productive.
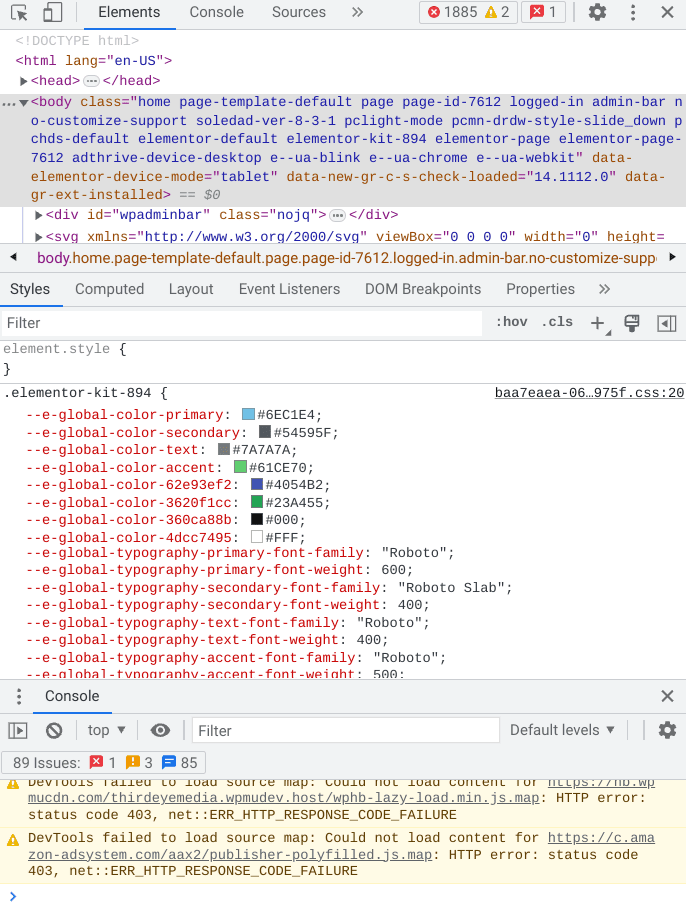
The “Elements” tab in DevTools
The “Console” area pertains to the JavaScript of a site’s page, and those of us who write code already realize how helpful that can be since it does not warrant heading to the back end for testing on-page changes. With “Console,” viewing what elements of a particular page can be tweaked is possible. The other major benefit of this tab is that it lets you affirm your changes by allowing you to self-message for test-based use cases—a real blessing for the developers.
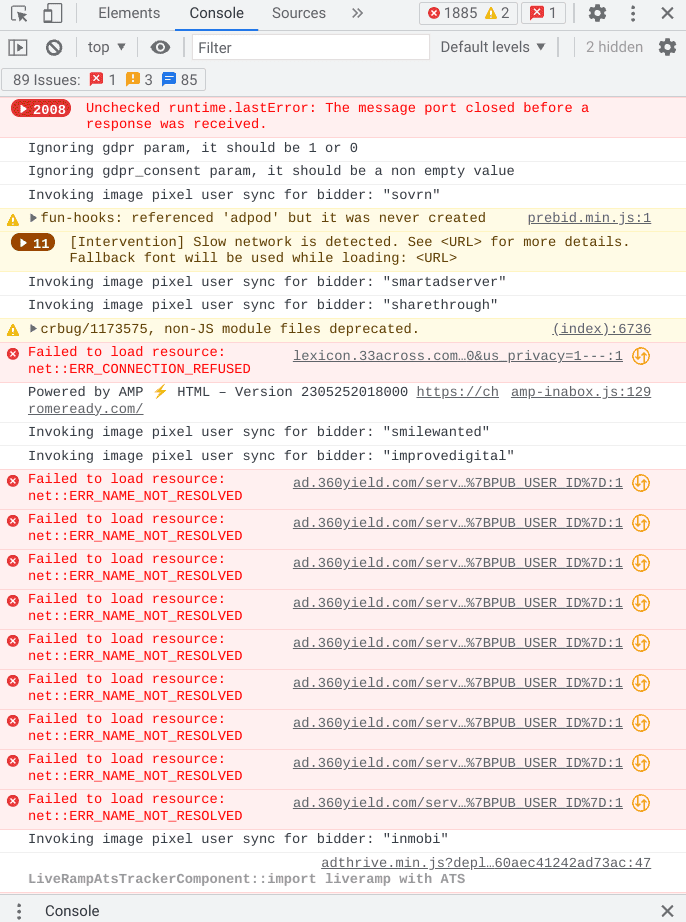
The “Console” tab in DevTools
Next up, we’ve got the “Sources” section, which comprises data utilized to create the website you’re viewing. Not just that, but in this tab, you can take a closer look at the data by further inspecting it. Among those two features, the “Sources” area allows setting breakpoints, so you can look into whatever code you’re inspecting for research purposes.
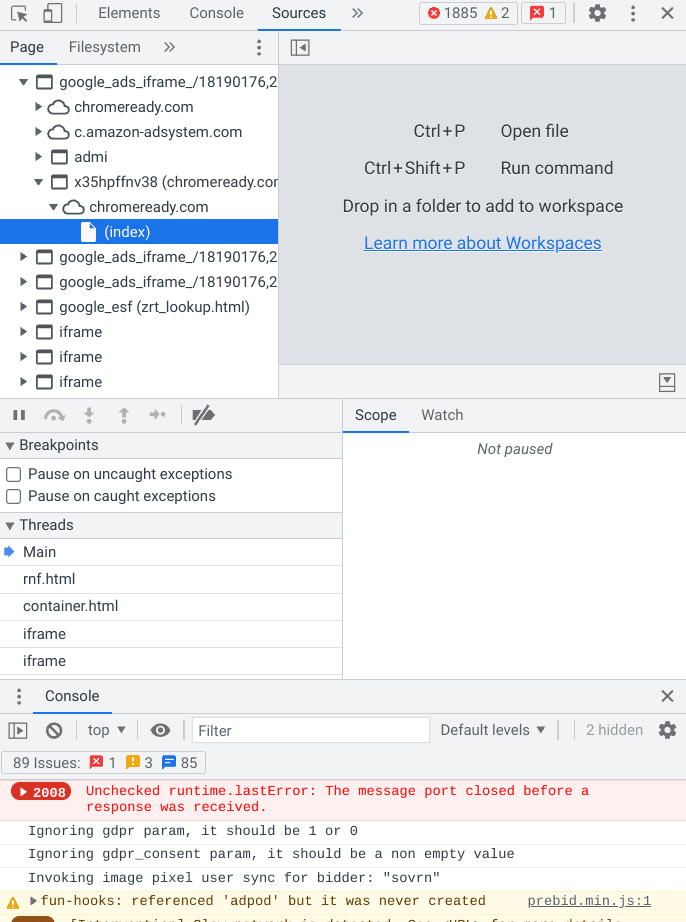
The “Sources” tab in DevTools
Moving forward, we’ve got the “Network” tab to discuss. This part of Chrome DevTools is more inclined toward the metrics that dictate site performance. It lets you analyze what resources are being utilized to load pages and what type of data comprises the URL of each page. To use it effectively, select a resource under the “Name” column to review its in-depth metrics. A bonus feature of the “Network” section is “Throttling,” allowing you to test throttle your internet speed.
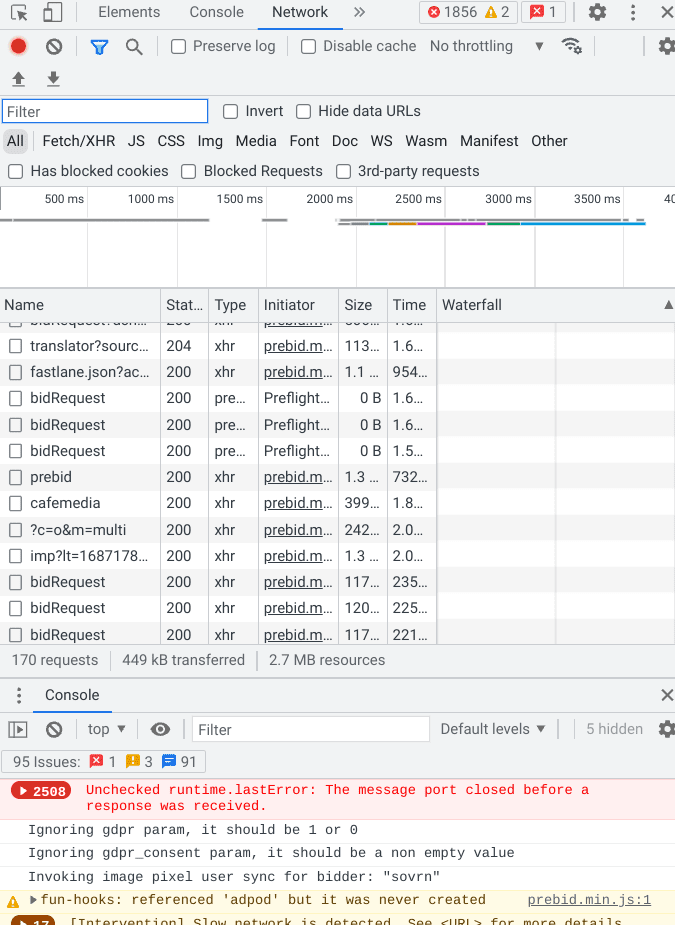
The Network tab in DevTools
The last of the primary aspects of the DevTools in Chrome is “Performance,” it’s all about gauging the speed of your site and what potential issues are barring your pages from loading optimally. It also incorporates an in-built feature to record your page’s loading, so you can go back and forth between different optimizations and test the effects of your changes. Also, examine each resource closely and determine what processes must be addressed.
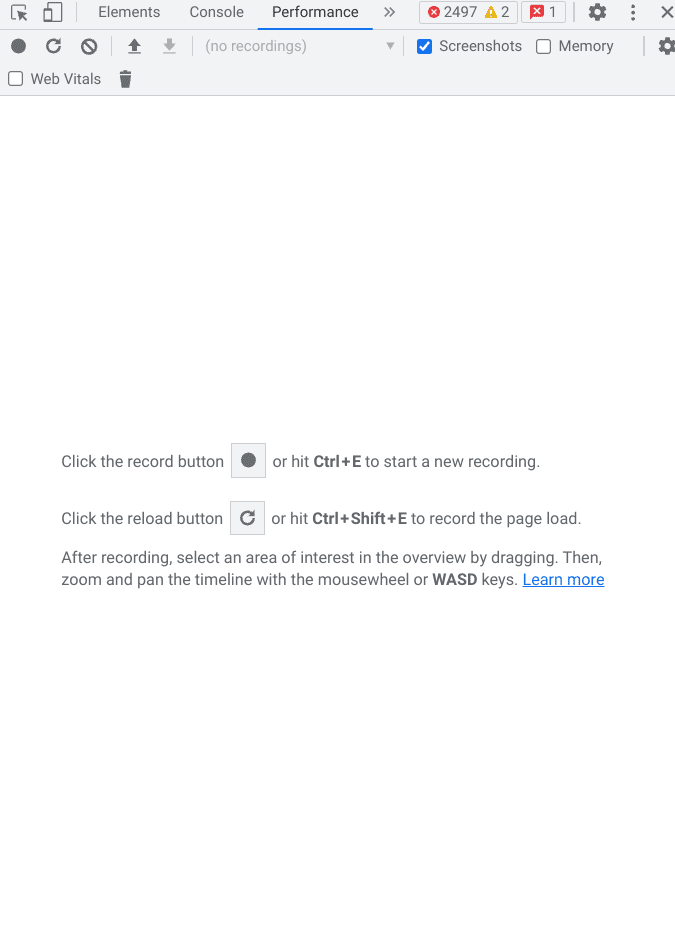
The “Performance” tab in DevTools
This has been a basic introduction to the Chrome browser’s developer console, and the best is yet to come. The following section will teach you what you can do with DevTools and gain the upper hand as a beginner or expert.
Best ways to utilize the developer tools in Google Chrome
The following is a range of features that the developer console in Google Chrome exhibits flawlessly. Make sure to go through each of these individually for the best results. These utilization methods will illustrate how convenient Chrome’s DevTools can be if used correctly and that many move forward while unaware of these helpful tips and tricks.
Tweak the CSS of any page.
One of the most sought-after features of Chrome DevTools is its on-page CSS editing. This functionality makes it seamless for developers and beginners to experiment with different styles and variations that ultimately influence how a site looks. For the uninitiated, CSS is shorthand for Cascading Style Sheets and determines the execution of HTML elements on website pages.
We realize how this coding jargon can get pretty complicated for those not yet programming experts, so we’ll try to explain each term in simple words. HTML is a universal internet standard that allows items to be displayed across the internet, thereby providing structure and sense to sites and breathing life into the wide interweb as we know it today. HTML and CSS go hand in hand. The latter can influence HTML in the way a developer desires.
We are going to further clarify with the help of an illustration here. To get started with editing the CSS, head over to the site of your preference and right-click on any element. It can be anything. For reference, let’s pick the “ChromeReady” text beside the site logo. Now, we’ll right-click it and select the “Inspect” button. Doing so should make the developer console pop up and take you to the metrics associated with the elements that you’ve highlighted.
Now, you have multiple measures available from here on out. To change the text of the element you’ve inspected, right-click the highlighted code and select “Edit as HTML.” Once done, you can rewrite the entire element code per your preference.
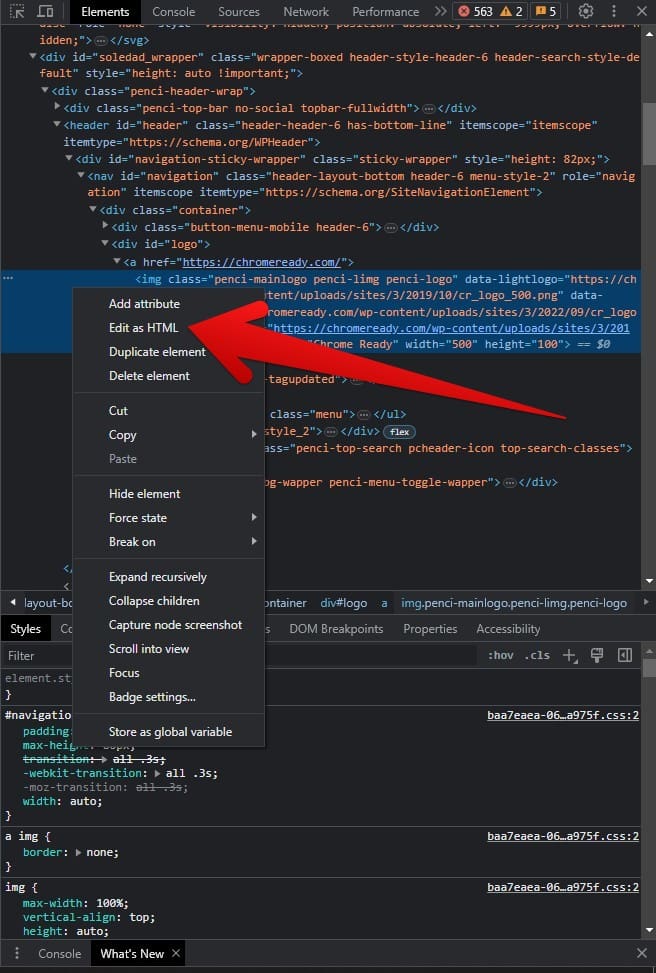
Editing the HTML of an element
Now, if it’s simply text that you desire to switch up for something else, you must look for the exact wording for successful results. We wish to change the “ChromeReady” site name in this case. The code of the element must contain this text. All we have to do is find it and replace it with whatever is desired, and that should be it. Once you find it, replace the original terms with what you want, and remember to press “Ctrl” and “Enter” together for the changes to apply.
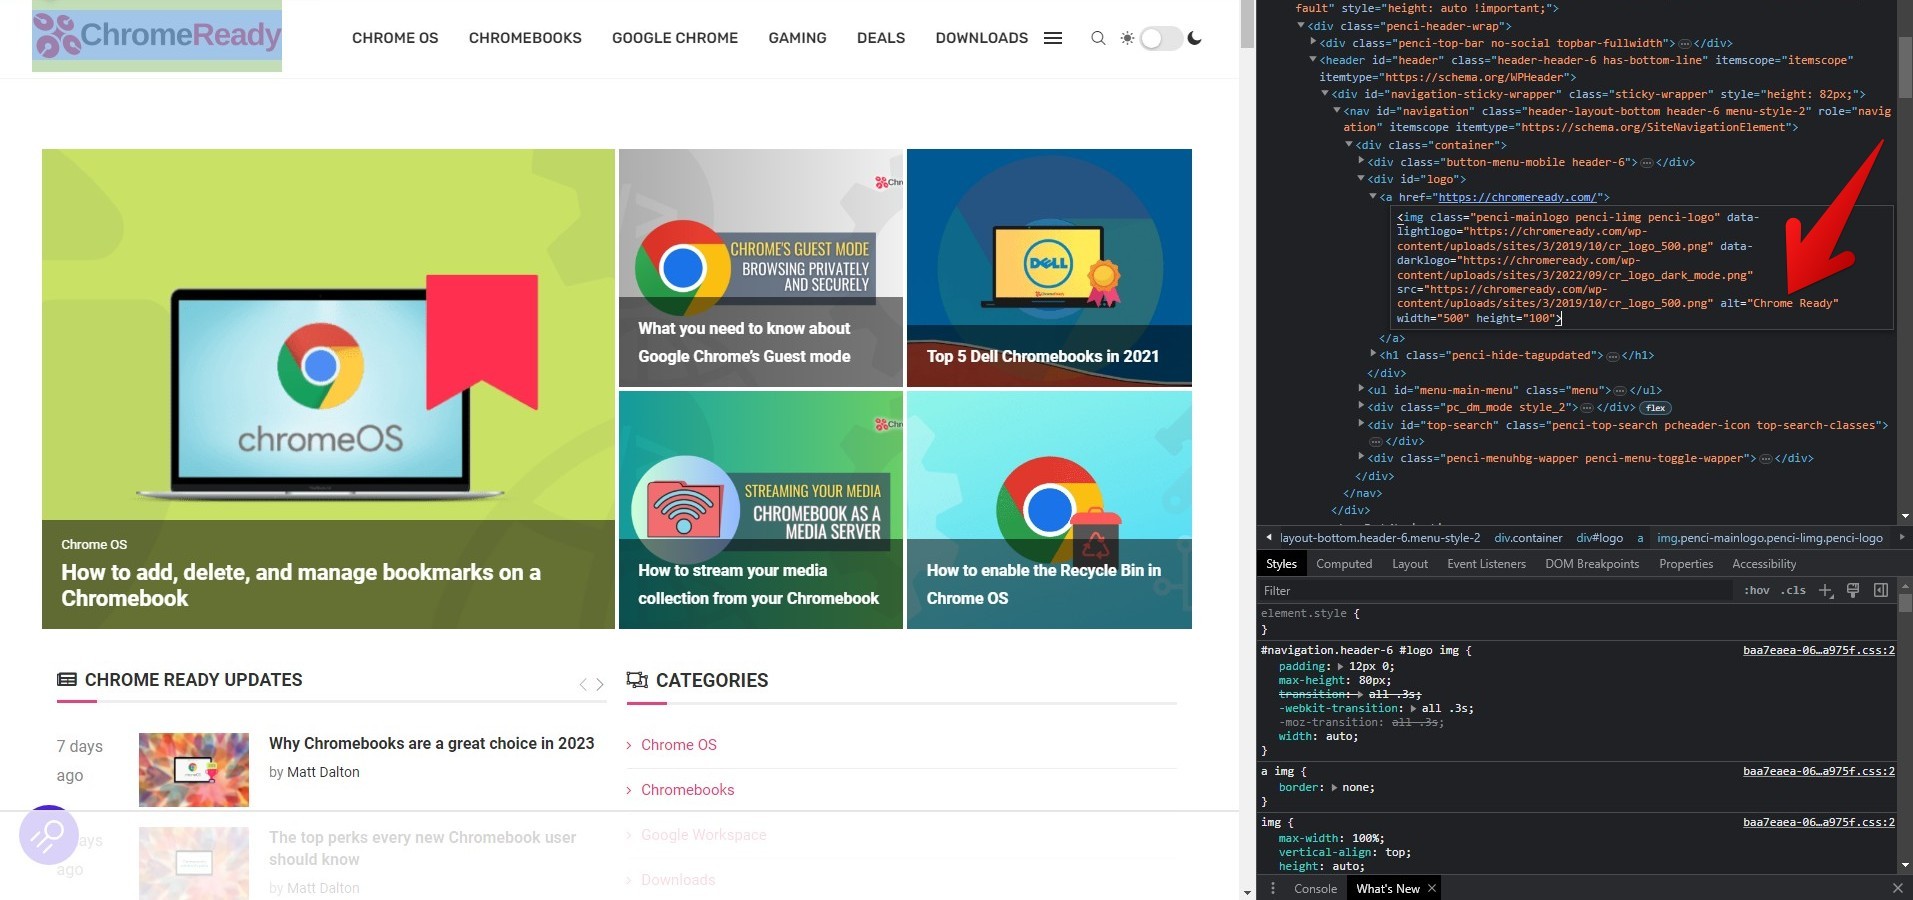
Finding the relevant text to change
CSS constitutes the styling of websites as well. You can effectively change the color of any perceivable text in a couple of clicks. To do that, you must first open the DevTools using any of the methods discussed above. Once done, click the “Select an element in the page to inspect it” button, otherwise triggered by the shortcut key combination of “Ctrl,” “Shift,” and “C” to get to the next step.
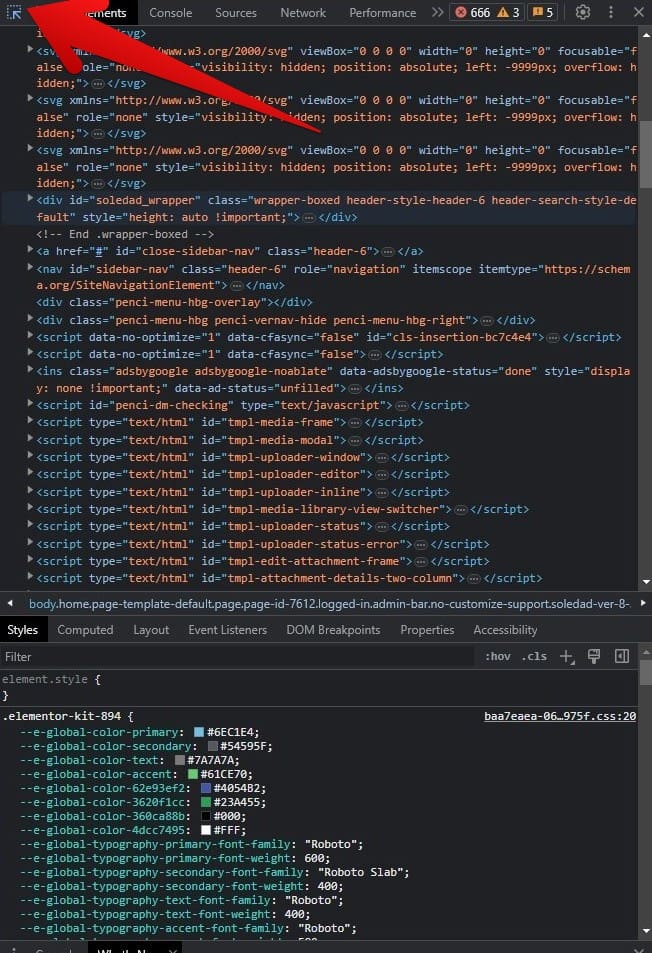
The “Select an element to inspect it” feature
You should now select the text whose color you want to change. Scroll through your options until you stumble upon the right choice. Click on it, and its code will be highlighted on the side panel to the right. In the DevTools area, look underneath the “Styles” section and search the color picker option for the text you’ve highlighted. You should be able to spot it with the help of the text’s existing color display. Click it, and a color picker will appear, allowing you to select easily.
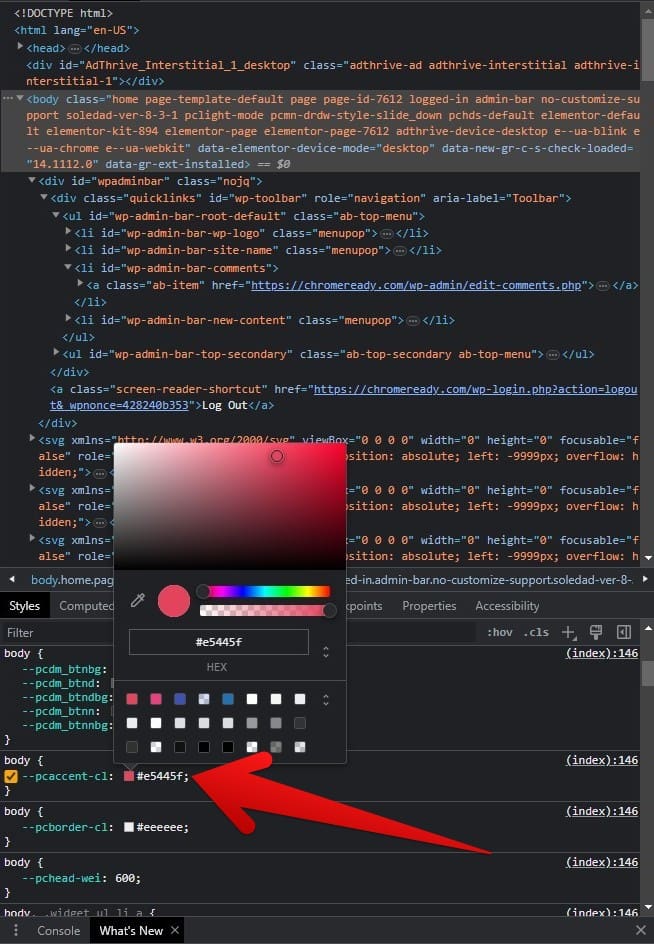
Changing the color of text with DevTools
Analyze competitor websites
One of the most significant advantages you can avail of with the developer console in Chrome is a deep dive into the Content Management Systems of competitor websites. If you wish to learn what software has a specific site used to build itself, you can figure it out painlessly using the “Elements” tab in DevTools. Start by going to the relevant site and opening the DevTools section afterward.
Once done, click on the “Sources” section next, and all the relevant directories for the site will pop right up for you to view. Now that you’re here, you must look for clues regarding the site’s build to ascertain the developer’s software. Terms such as “wp” will be embedded in WordPress sites. For other programs, their respective initials will be present somewhere in the “Sources” panel.
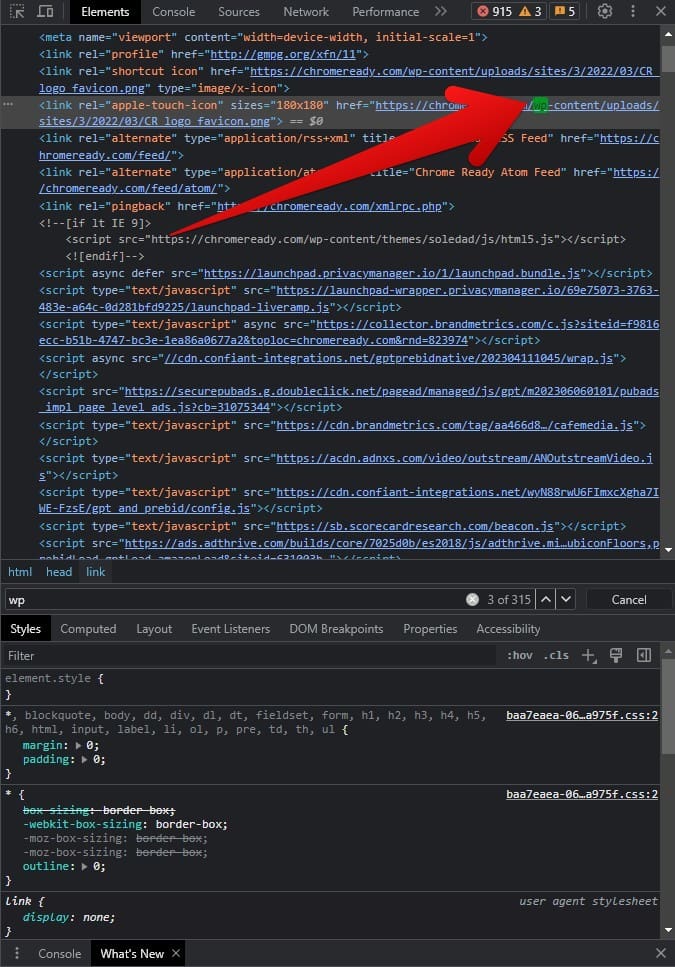
Mention of WordPress in the DevTools section
View the mobile version of sites easily
Did you know that you could preview the mobile version of websites on your desktop with the help of the developer console? The feature is utterly convenient and helps negate many potential issues for developers from a debugging perspective, allowing them to prepare for possible problems. To begin, visit any website and open Chrome DevTools. After that, click on the “Toggle device toolbar,” otherwise initiated with the “Ctrl,” “Shift,” and “M” keys.
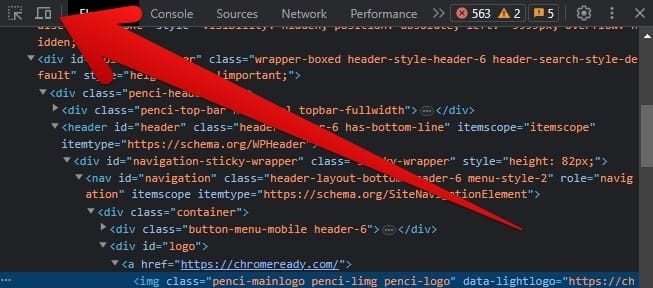
Toggling the view mode
You should now see the site you have opened transition into its mobile mode for viewing. The process is quick and smooth, and powerful beyond its base function. Adjust the zoom level according to your liking as soon as the site’s view mode has been toggled. In addition, you can switch up the dimensions of the mobile view mode as well. The option is either set to “Responsive,” or a particular phone model is selected, such as the iPhone SE or iPhone XR.
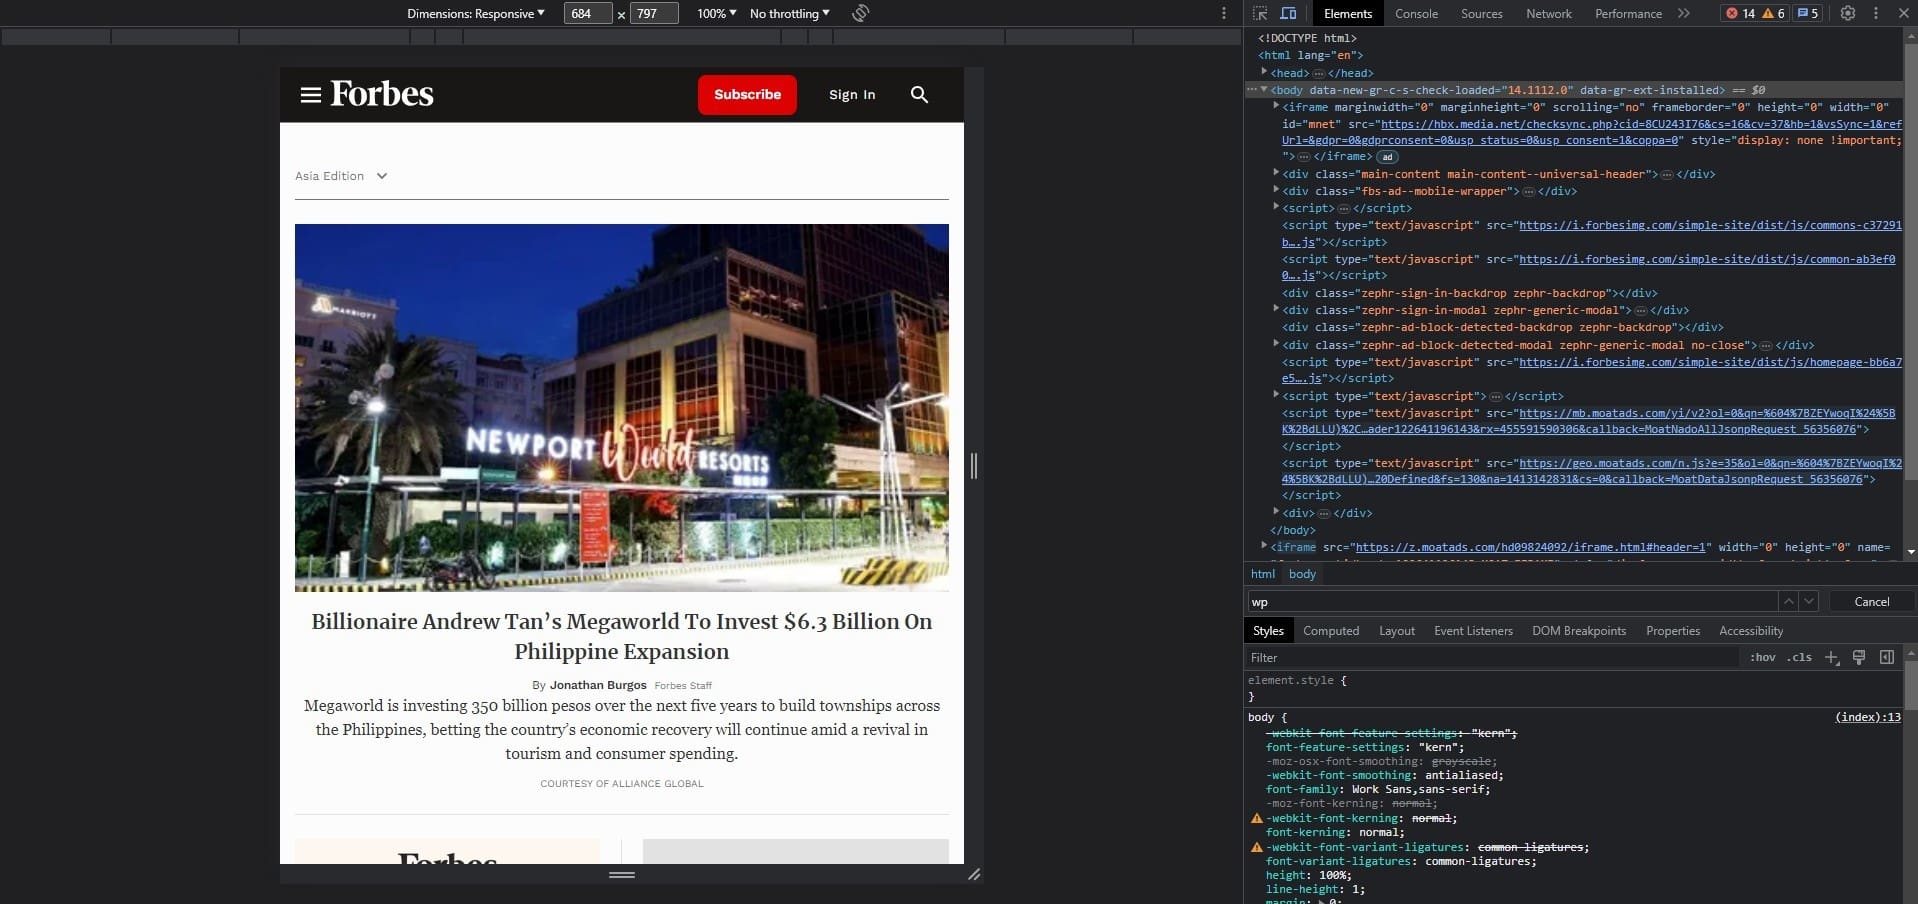
A website in mobile view mode
Look into site speed problems
One of the best ways to utilize the DevTools feature of Google Chrome is by assessing the resources a website is hoarding and what type of data is causing speed issues, if any. This diagnostic measure is a popular use case taken up by devs who rely on the developer console daily. Proceed by heading to the site of your interest and opening the DevTools feature in the Chrome browser.
After that, click the “Network” tab at the top of the developer console, and you should immediately be able to spot all the resources the site takes to load up pages. Alongside that, the load speeds will be laid out for you to cross-check, simplifying the whole troubleshooting process for concerned developers. Assess the size of each resource on multiple occasions and contact the people on the back end if needed to relay the pertinent trouble causes.
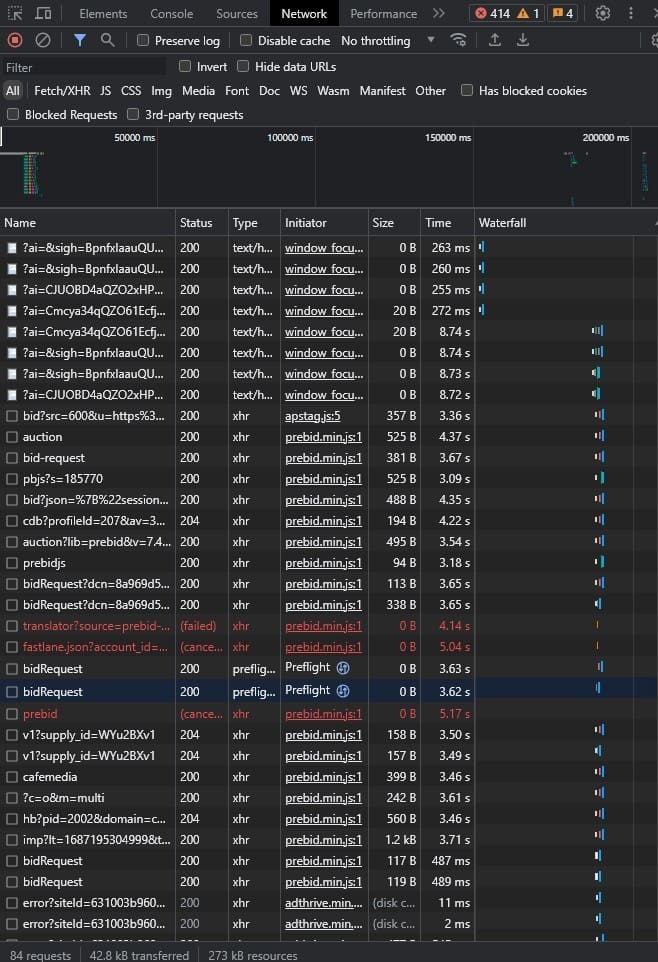
Addressing load speed issues with DevTools
Identify the exact colors of a site
Expanding upon the color-changing feature of DevTools that we’ve highlighted above, the developer console can help you determine the hex code of a specific color you’ve stumbled on while visiting a website. Acquiring the hex code means pinpointing the exact color, so there are 0 discrepancies. The procedure for this will play out similarly to the use cases above. Head to a site and fire up DevTools to get going.
You next need to use the “Select an element on the page to inspect it” feature to be able to highlight a distinct element. After enabling the functionality, click on what attracts you to make its code appear in the DevTools section. Underneath the “Styles” panel, scroll down until you observe the matching color. Click the color button, and a picker menu will appear, allowing you to copy the hex code.
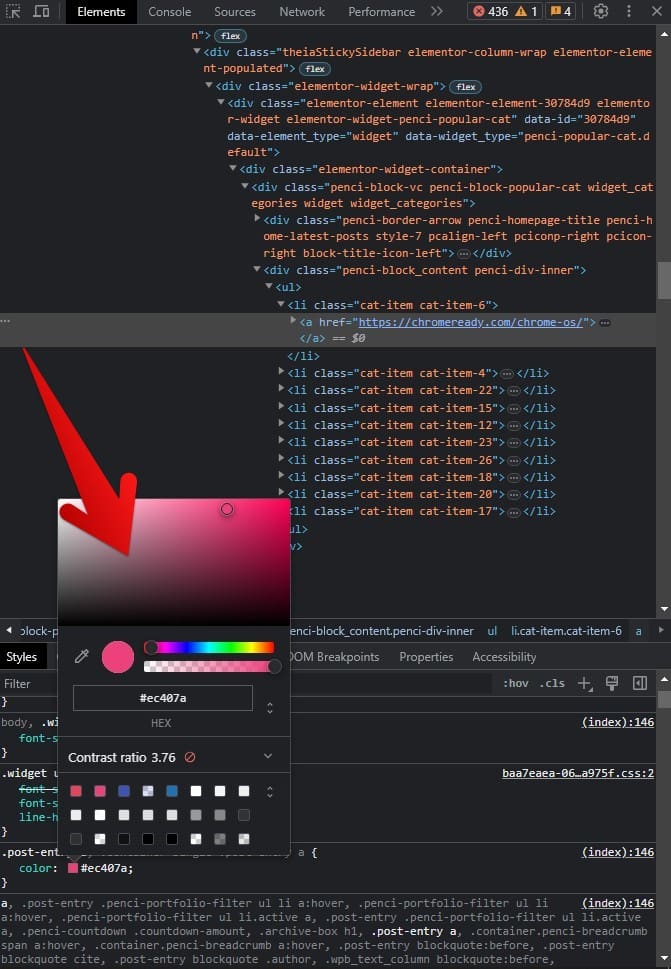
The color picker in DevTools
Change the theme of the DevTools as per preference
In case the DevTools console is not following your system’s theme, do not worry. You can easily change the feature by heading to its “Settings” section. After opening the developer console, click the cog-shaped settings icon, and you should quickly be able to visualize the preferences area. Here, you can tweak various parameters of Chrome’s DevTools, including shortcut specifications, location settings, and more.
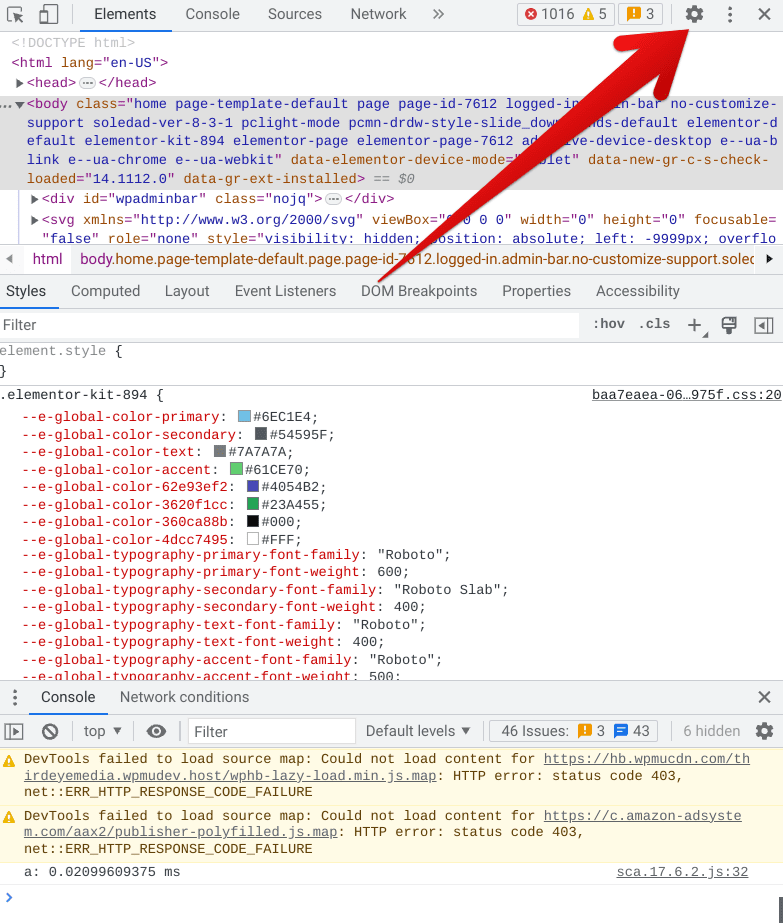
Opening the settings section of DevTools
You should now be automatically taken to the “Preferences” area within DevTools’ settings. You’ll observe “Appearance” at the very top, so there’s no need to go down the list of locations. From there, click the currently applied option, and you’ll be able to adjust the theme of the developer console accordingly. If it’s the dark mode you desire, choose “Dark,” you should be done immediately.
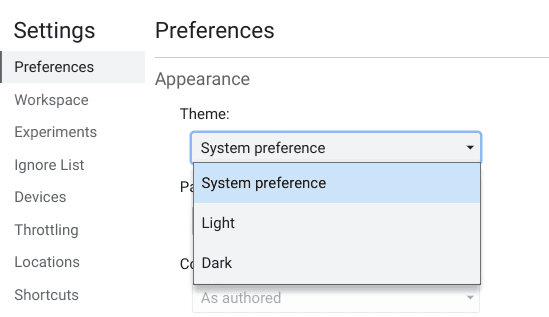
Tweaking the appearance of the DevTools console
Download images on the fly
With the help of Chrome DevTools, it’s also possible to download images present on any website without having to take other measures. Not many are aware of this cool technique that you no longer have to seek other measures, such as Google Lens or manual Google Image search with relevant keywords if you know how to utilize Chrome’s developer console, for that matter. You must head to any relevant site, right-click on the required photo, and select “Inspect.”
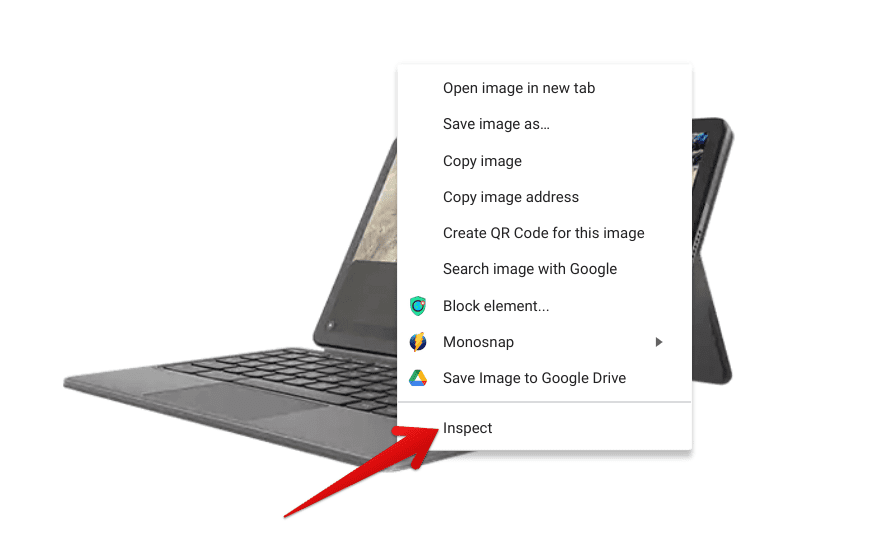
Inspecting an image
Your job now is to focus on the highlighted code of the image and look for a URL that starts with “https.” That is the link to the image that will be accessed for its seamless downloading. Copy it with your cursor and paste it into the address bar of a new tab. That should take you to the next step.
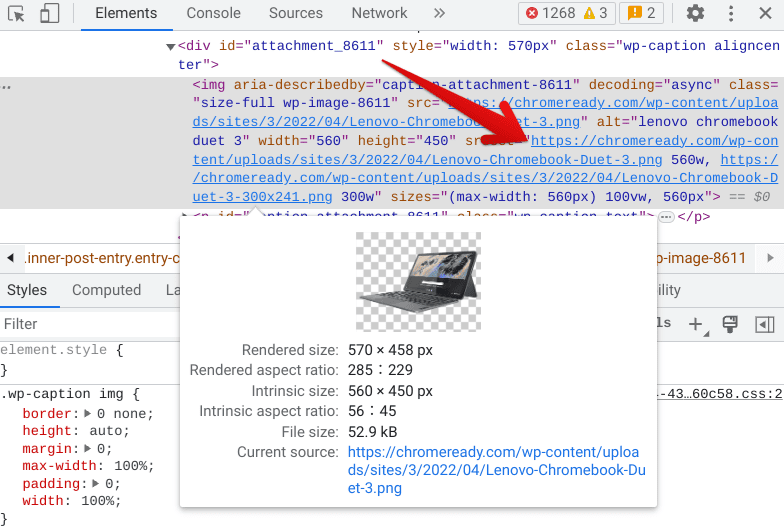
Copying the link of the image in DevTools
As the link loads, the image will appear on your end. Right-click on the image, select “Save image as” like the usual process and proceed toward downloading it. That will be all. You can now repeat the same process on any web page regardless of its original format.
Conclusion
Amidst the bustling competition of today’s internet browsers, Chrome is the most popular for not just one but a myriad of reasons. It’s the go-to browser for billions of users for its speed and simplicity, not to mention the availability of extensions from the Chrome Web Store that heighten its overall value output. However, it’s not just the features at the forefront of Chrome that have attracted such a huge user base; some extra goodies are also hidden in Chrome.
One is the developer console inside the browser, loaded with developer tools from top to bottom to facilitate devs and everyday folks in several scenarios. Whether you’re a web designer looking to test out fresher layouts and designs or a developer scanning the competition’s tech and fixing load speed problems about your site, the dev toolkit in the browser will cater to your requirements on the fly.
Let us know in the comments section whether you found this guide helpful. We would love to read your feedback!
