As you would already know, Chrome is one of the most widely used browsers out there. However, like any other software or application, it can still experience performance issues that severely impact your browsing experience. If you’ve ever faced a slow or unresponsive browser, you know how frustrating it can be. Fortunately, Chrome has a built-in task manager that can help you diagnose and resolve such performance issues.
This article will explore how to use Chrome’s task manager to identify problematic tabs or extensions, monitor resource usage, and manage multiple tabs, which can help you improve the overall experience. Has your Chromebook been lagging and presenting performance issues lately? Learn how to monitor system performance on a Chromebook.
What is Chrome task manager?
Chrome Task Manager is a built-in tool in Google Chrome that allows users to monitor and manage the browser’s performance. It provides a detailed view of the browser’s resource usage, such as CPU, memory, and network usage, as well as the resource usage of individual tabs and extensions.
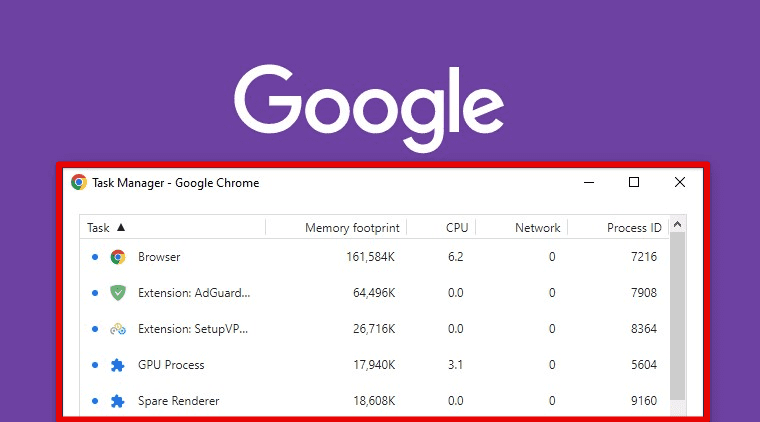
Google Chrome task manager
To access Chrome Task Manager, users can click on the Chrome menu in the top-right corner of the browser and select “More tools” > “Task manager”. Alternatively, users can use the keyboard shortcut “Shift + Esc” on Windows and Chrome OS or “Shift + Command + Esc” on Mac.
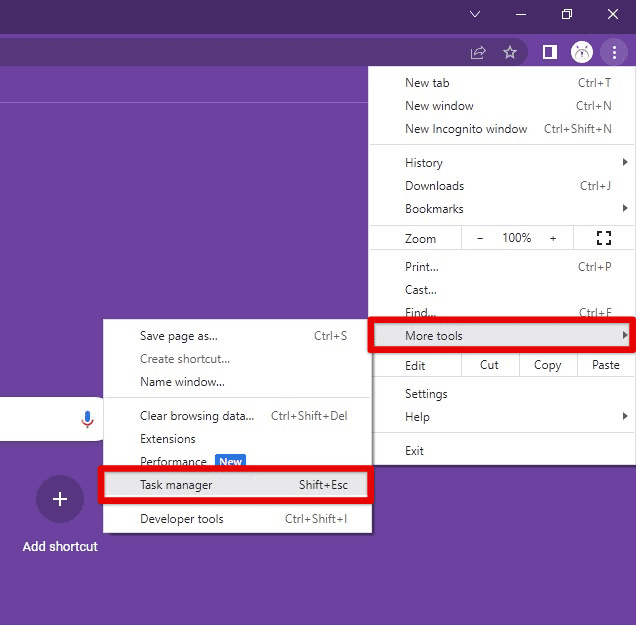
Opening Google Chrome task manager
Once opened, Chrome Task Manager displays a list of all the tabs, extensions, and processes running in the browser, along with information about their resource usage. You can quickly sort the list using metrics, such as CPU or memory usage, to identify problematic areas. This task Manager provides you with valuable insights into Chrome’s performance. It allows quick identification and management of problematic tabs and extensions, monitoring resource allocation, and taking control of the underlying processes.
Why is Chrome task manager useful for improving browser performance?
Chrome Task Manager is a valuable tool for improving browser performance as it helps users identify and address performance issues that can impact several other applications. Providing a detailed view of the browser’s processes allows users to quickly identify any problematic tabs or extensions causing slow performance or crashes.
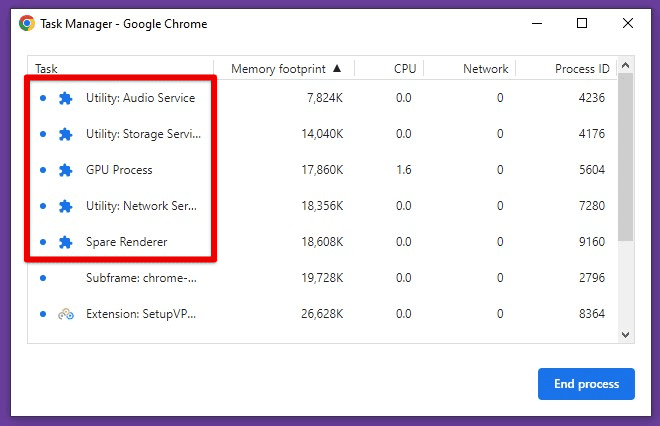
Browser processes
With the help of Chrome Task Manager, you can easily monitor resource usage and detect any potential memory leaks or excessive CPU usage that could be slowing down Google Chrome. Users can also use the tool to identify which tabs or extensions are draining the most resources and take action to free up memory or terminate them as needed.

Resource usage
Another advantage of using Chrome Task Manager is that it can help troubleshoot and diagnose performance issues caused by third-party applications or malware. If a user notices unusual behavior in their browser or system, they can employ the task manager to identify which processes are causing the issue and take action to stop them as soon as possible.
Opening Chrome task manager
Opening the Google Chrome Task Manager is relatively easy. However, you can do so in a few different ways.
Using the Google Chrome menu:
Click on the three-dot icon in the top-right corner of the Chrome browser to open the Chrome menu. Next, go to “More tools” in the drop-down menu. Next, click “Task manager” in the “More tools” sub-menu window.
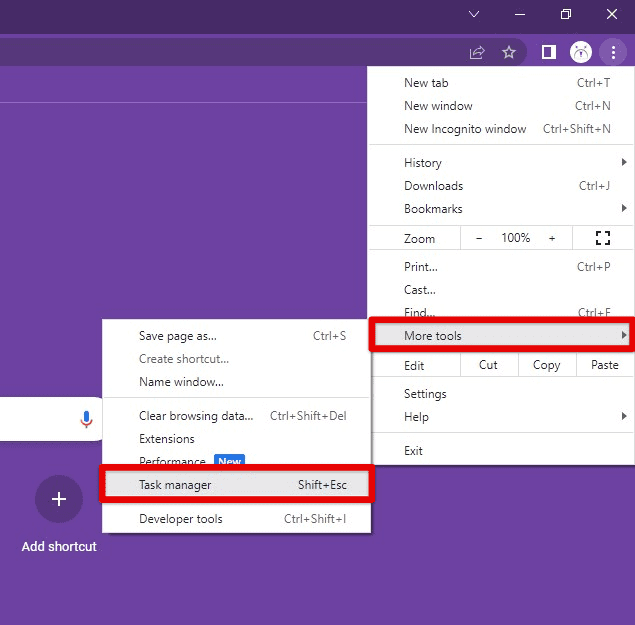
Accessing task manager from the Chrome menu
Using keyboard shortcuts:
Press “Shift + Esc” on Windows or Chrome OS.
Press “Shift + Command + Esc” on Mac.
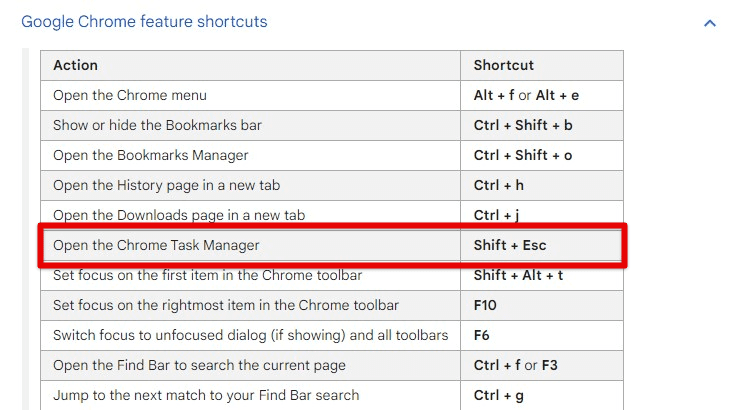
Accessing task manager with the keyboard shortcut
Once you’ve opened the Task Manager, you’ll be presented with a list of tabs, extensions, and processes running in the browser. From here, you can sort the list by various metrics, such as CPU or memory usage, to quickly identify any issues.
If you’re experiencing slow performance or crashes, use this manager to identify which tabs or extensions are using the most resources and take action to manage or remove them accordingly. Additionally, you can use it to monitor Chrome’s memory allocations, which helps optimize browser processes and web apps.
Understanding task manager metrics
Chrome Task Manager provides a wealth of information about the browser’s performance, including CPU, memory, and network usage metrics. Understanding these metrics is crucial to identifying and addressing performance issues that may impact your browser. The metrics displayed in the Chrome Task Manager include the following:
CPU: Indicates the percentage of CPU resources used by each tab, extension, and process. High CPU usage can cause slow performance, freezes, or crashes.
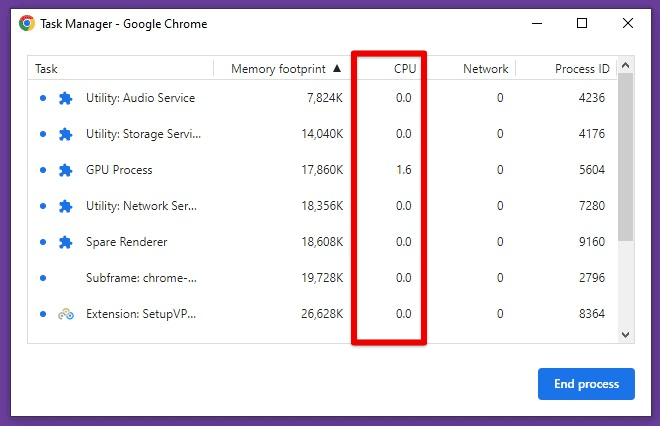
CPU
Memory: Indicates the amount of memory used by each tab, extension, and process. High memory usage can slow down your browser and cause it to become unresponsive.
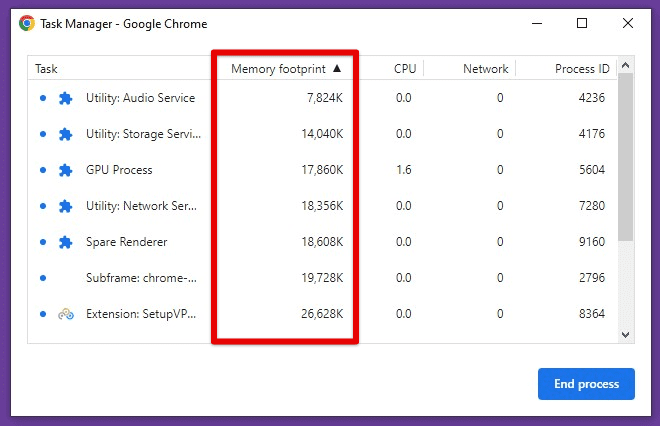
Memory
Network: Shows the amount of network data being transferred by each tab, extension, and process. High network usage increases page load times and impacts the transitions from one tab to another.
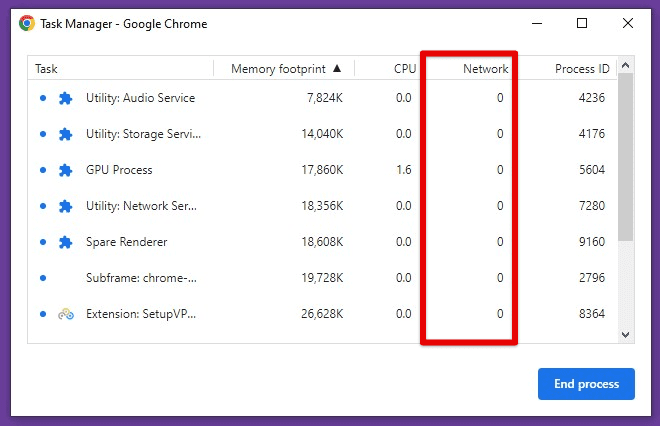
Network
Process ID: A unique identifier for each browser tab, extension, and process running. It can help identify which processes are causing performance issues in the current session.
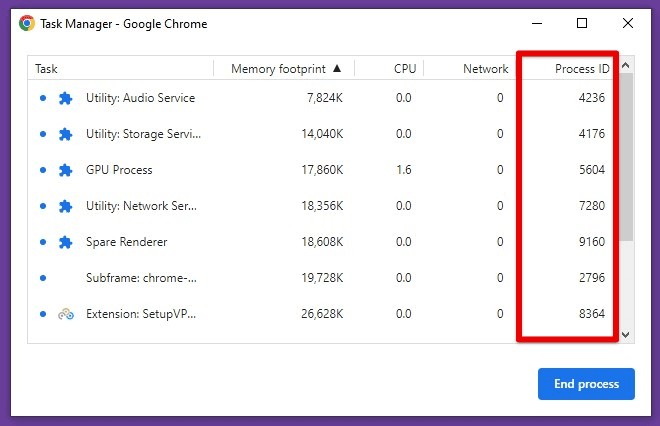
Process ID
By monitoring these metrics in the Chrome Task Manager, you get more equipped to decide which applications to remove and which processes to terminate. This makes sure that your browser keeps on running smoothly.
Chromebooks come in all shapes and sizes, support all sorts of functionality, and are even a favorite in the education sector. Also, enterprise-ready Chromebooks are now a thing, and many businesses and large-scale organizations have picked this operating system up as their daily driver. Want to explore yourself? Have a look at the top 10 Chromebooks for best performance.
Identifying problematic tabs or extensions
One of the most valuable features of Chrome Task Manager is the ability to identify which tabs or extensions are causing issues in the browser. Following are the steps to identify the problematic processes with the Chrome Task Manager:
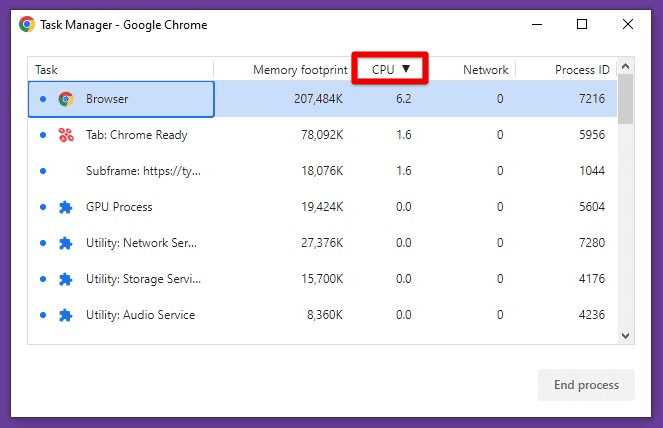
Open the Chrome Task Manager by pressing “Shift + Esc” on Windows or Chrome OS and “Shift + Command + Esc” on Mac. Sort the list by CPU or memory usage to identify which tabs or extensions use the most resources.
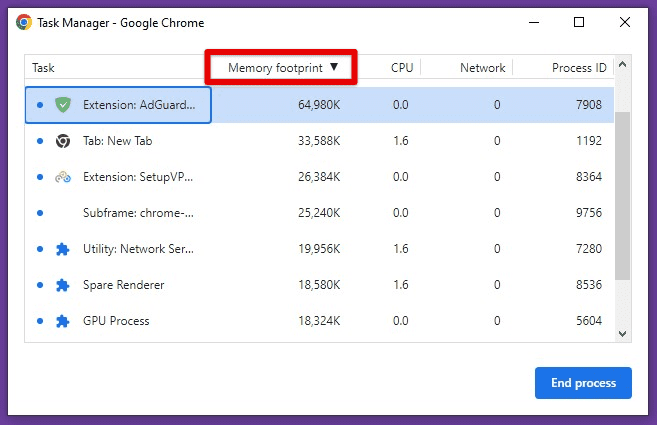
Sorting by memory usage
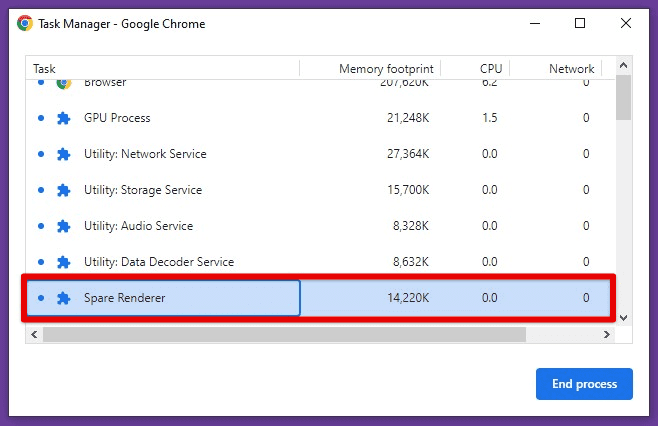
Click on the tab or extension that is causing high resource usage to select it. Then, click the “End Process” button to close that process simultaneously.

Ending a process with the task manager
Alternatively, you can right-click on the tab or extension and select “End Process” from the context menu. By identifying and closing tabs or extensions that use too many resources, you can improve your browser’s performance and prevent it from becoming unresponsive or crashing. It’s also a good idea to regularly monitor Chrome Task Manager even if there are no apparent issues. Doing so ensures your browser does not fall headfirst into a severe crash.
Managing browser performance
Chrome Task Manager makes it possible to use several options for managing the browser’s performance. Following are some tips and tricks for managing Google Chrome’s performance with the help of this task manager:
Killing problematic extensions: As described earlier, Chrome Task Manager can help you identify which tabs or extensions are using too many resources and causing performance issues. Closing these problematic tabs or extensions can free up memory and improve the loading and response times.
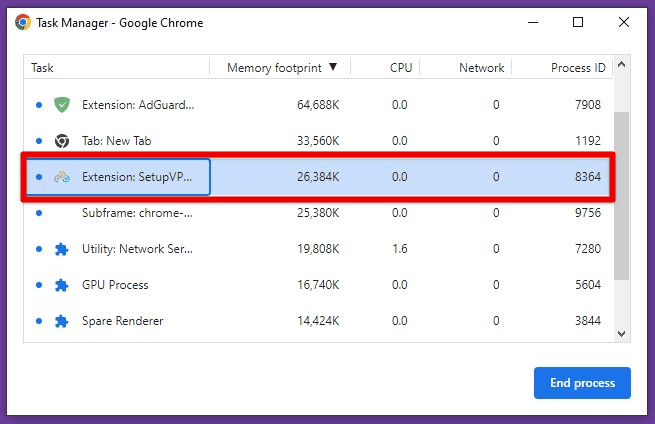
Killing problematic extensions
Monitoring resource usage: Keeping an eye on CPU, memory, and network usage in Chrome Task Manager can help you proactively identify and address critical performance issues. If you notice that a particular tab or extension is using too many resources, you can take action to manage or remove it before it causes more serious problems.
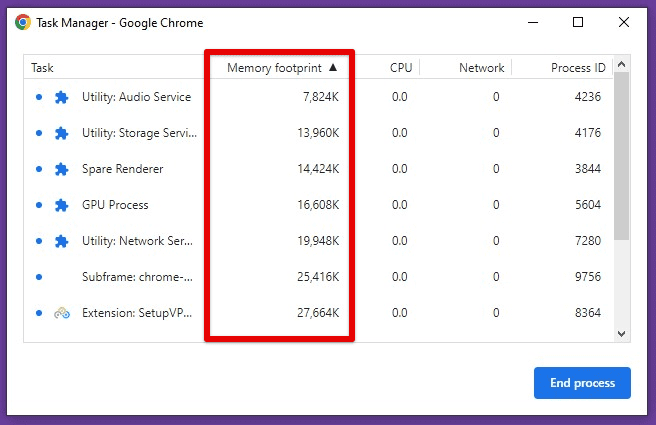
Monitoring resource usage
Managing multiple tabs: Having multiple tabs opened simultaneously can be convenient, but it may also impact your browser’s ability to respond as effectively. Chrome Task Manager can help you identify which tabs use the most resources and close them if necessary. The task manager is also able to identify problematic tab groups as well.

Managing multiple tabs
Updating Chrome and extensions: Keeping Chrome and your extensions up to date can also help improve performance. New updates often include bug fixes and performance improvements, so check for these regularly.
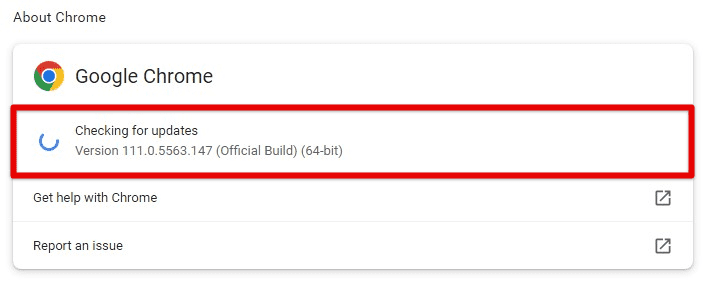
Updating Chrome and extensions
Disabling unnecessary features: Chrome has many features that can be useful in specific scenarios, but not always. Keeping them enabled at all times only consumes extra memory without any utility to the end user. You can use Chrome task manager to pinpoint and disable such features in the browser.
Advanced task manager tips
Chrome Task Manager lets you access plenty of information about browser performance, and there are some advanced techniques you can use to get even more insights. Following are some advanced tips for using Chrome Task Manager:
Enabling custom metrics: The task manager enables custom metrics to track specific performance indicators. To enable a custom metric, right-click on any existing metric column and select “Add column”. You can choose from various metrics or create a custom one using JavaScript.
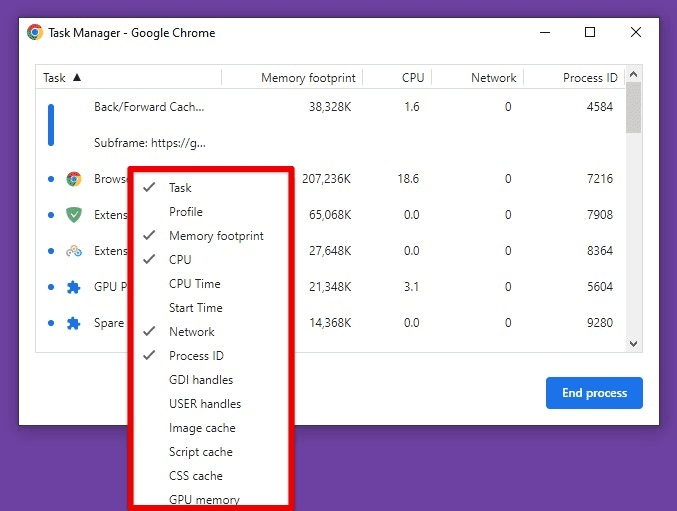
Enabling custom metrics
Using filters: Chrome Task Manager also enables you to filter the list of tabs and extensions by various criteria, such as memory usage or network activity. To apply a filter, click the filter icon at the top of the task manager and select the criteria you want to use.
Using filters
Analyzing browser settings: Some browser settings can impact performance, and Chrome Task Manager can help you identify which settings have the biggest impact. For example, you can use it to compare performance with and without hardware acceleration enabled or to analyze the impact of ad-blocking extensions on network usage.
Analyzing browser settings
Monitoring system resources: In addition to monitoring browser performance, Chrome Task Manager can show you how your browser impacts system resources such as device memory. This helps identify and address issues caused by other applications running on the same system.
Conclusion
By monitoring CPU, memory, and network usage, you can use Chrome Task Manager to identify problematic tabs or extensions and take action to manage or remove them as required. Additionally, using Task Manager’s advanced features, like custom metrics and filters, can help you gain even more insights into your browser’s performance and optimize it for maximum efficiency.
By following the tips and tricks outlined in this article, you can take control of all active processes and ensure that the browser keeps running as smoothly as ever. So, the next time you notice your browser slowing down or behaving erratically, open up Chrome Task Manager and investigate the problem yourself. Do you want to speed up Chrome’s launch time, enhance browsing capabilities, or maximize its privacy and security features? Learn how to customize Chrome browser settings for optimal performance.

1 comment
I’m using a Pixelbook with the M112 update applied, and my Task Manager does not have many of the features that you’ve mentioned. Have you confused this Task Manager with some other OS?
I do not have filters.
There is no context menu for individual tasks.
There is no option to add a custom metric.