In today’s world, web development has become essential to creating digital content. With a growing demand for user-friendly and engaging web experiences, developers and designers need tools to help them achieve their goals efficiently. Chrome DevTools is a set of web developer tools that allow developers to inspect, debug, and optimize their web pages.
However, with so many features available, it can be overwhelming for beginners. This article will provide some tips and tricks to help you master Chrome DevTools. This may give you a better understanding of how to employ them effectively in different use cases. ChromeOS also has a dedicated developer mode that lets power users go the extra mile and unleash a Chromebook’s development-centric capability. Learn all there is to the developer mode in a Chromebook.
Setting up Chrome DevTools
This section will cover how to access DevTools and some basic settings that can be adjusted.
Accessing Chrome DevTools
Open the Chrome browser and navigate to the web page you want to inspect. Next, Right-click on any part of the web page and select “Inspect” from the context menu.
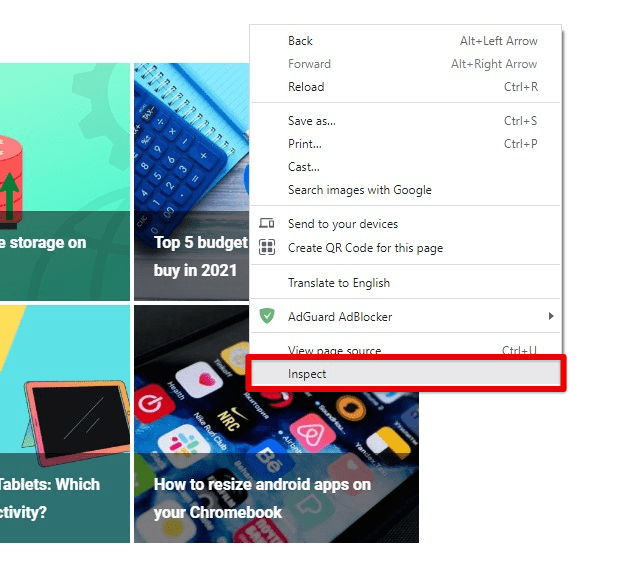
Accessing Chrome DevTools
Alternatively, you can use the keyboard shortcut “Ctrl + Shift + I” (Windows and Linux) or “Command + Option + I” (Mac) to open DevTools.
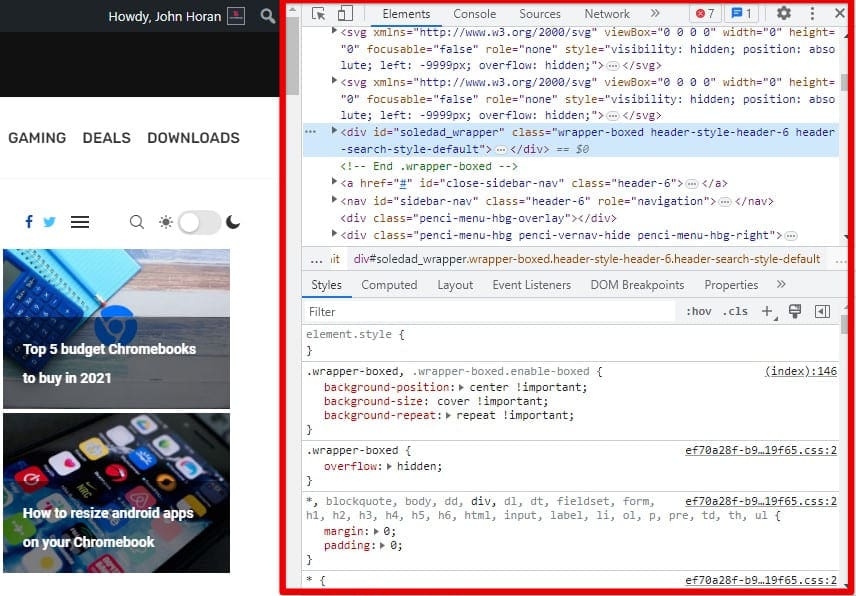
Chrome DevTools opened
Once DevTools is open, you can adjust some basic settings to make it more user-friendly.
Basic settings
Docking position – You can change the window’s position by clicking and dragging it to the bottom, right, or left or undocking it to a separate window.
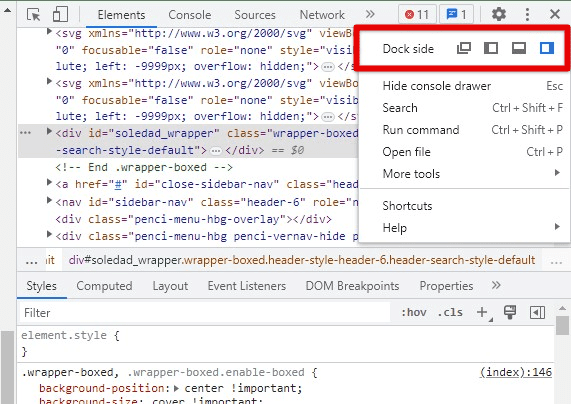
Dock side of Chrome DevTools
Zoom – If you have trouble reading the text, adjust the zoom level by pressing “Ctrl” (Windows and Linux) or “Command” (Mac) and scrolling the mouse wheel.
Dark mode – DevTools supports dark mode, which can be enabled by going to the DevTools settings (gear icon in the top right corner) and selecting “Dark theme.”
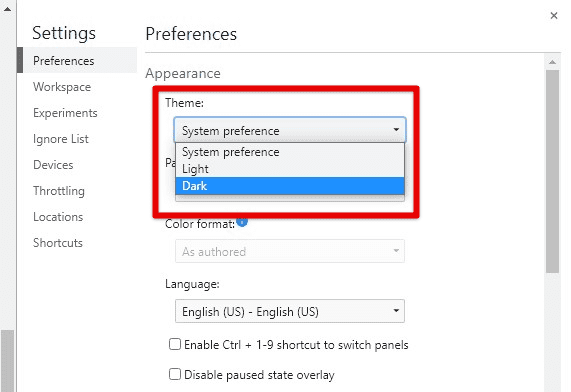
Changing DevTools appearance with a dark theme
In addition to these basic settings, there are many other advanced settings that you may customize to suit your needs. However, we recommend exploring them only after you have become accustomed to the interface and have mastered your way in the web development journey.
Inspecting HTML and CSS
The Elements tab allows developers and designers to inspect the HTML and CSS of a web page and make changes to the code in real time. This section will cover how to use the Elements tab to inspect and modify this code.
Step 1: Open the web page you want to inspect in Chrome. Go to DevTools by right-clicking on any part of the web page and selecting “Inspect” or using the keyboard shortcut “Ctrl + Shift + I”.
Step 2: Go to the Elements tab in DevTools. In the Elements tab, you can see the HTML structure of the web page in the top panel and the CSS rules applied to the selected element in the bottom panel.
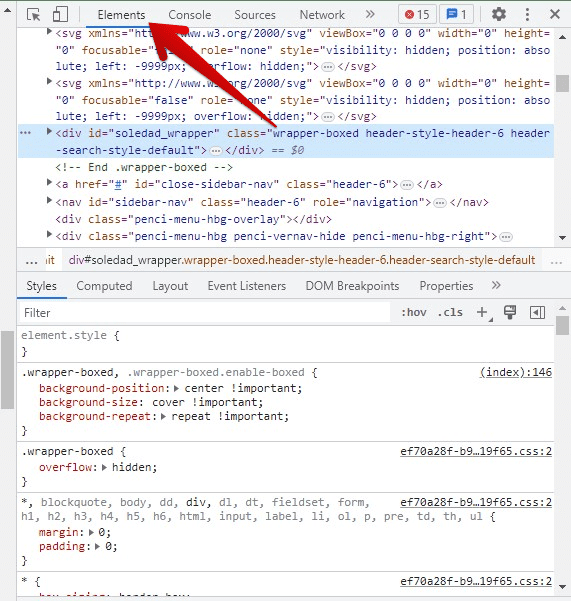
Elements tab in Chrome DevTools
Step 3: To inspect an element, click on it in the top panel. The corresponding CSS rules for that element will be displayed at the bottom. You can modify the CSS rules by double-clicking on them as well.
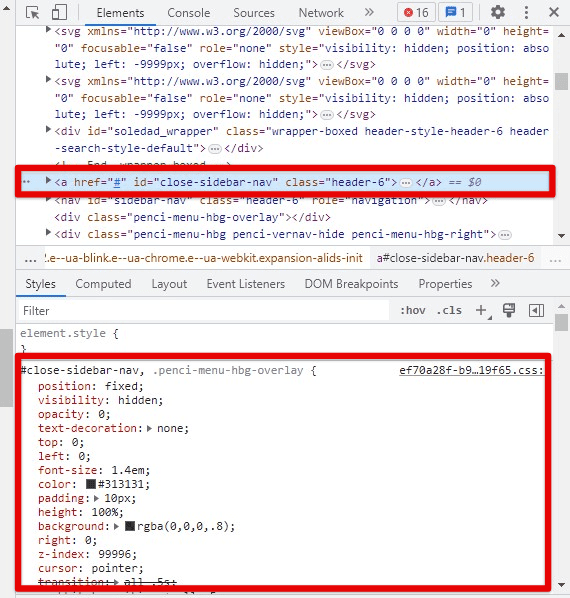
HTML element with corresponding CSS in the bottom
Making changes to HTML and CSS
Step 1: Select the element you want to modify—Double-click on the HTML code to change the content.
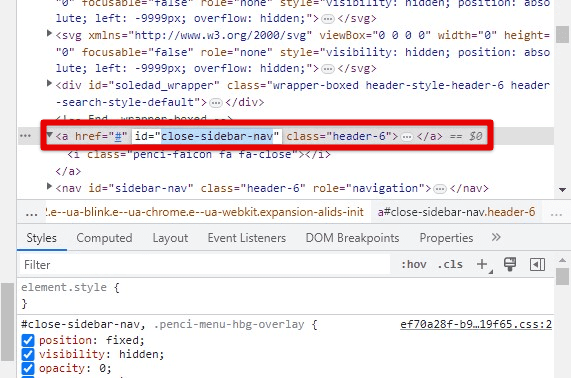
Modifying HTML in DevTools
Step 2: Double-click on the CSS rule in the bottom panel to modify the style.
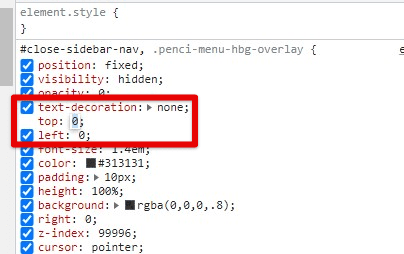
Modifying CSS in DevTools
Step 3: Press “Enter” to save everything after making changes.
Note: Changes made in DevTools are only temporary and will not be saved to the original source code of the web page.
Using the Elements tab in Chrome DevTools, you can quickly inspect and modify the HTML and CSS of any web page on the internet. This can be useful for debugging and testing out different design ideas.
Debugging JavaScript
The Console tab allows you to debug JavaScript code. This section will cover how to use it and some tips for finding and fixing common errors.
Step 1: Open the web page you want to debug in Chrome. Go to DevTools by right-clicking on any part of the web page and selecting “Inspect” or using the keyboard shortcut “Ctrl + Shift + I”.
Step 2: Select the Console tab in DevTools. In the Console tab, you can type JavaScript code directly and see the output in real time. You can also use the console to execute JavaScript commands and functions and debug existing code.
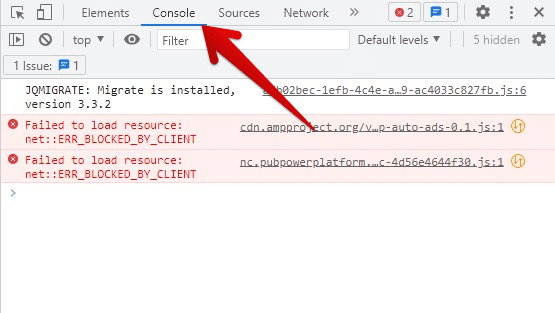
Console tab in Chrome DevTools
Step 3: To debug JavaScript, use the following tools:
Console.log() – This method allows you to log information to the console, which can be helpful for debugging.
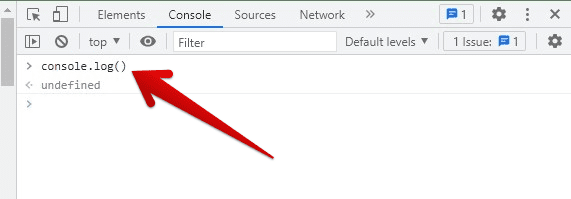
console.log() method
Breakpoints – Set breakpoints in your code to pause the execution at a certain point, allowing you to inspect the state of the code at that point.
Step through code – Step through your code one line at a time to see how it is executed.
Learning how to enable JavaScript on Google Chrome is one of the best things to do when you intend to manifest your Chrome browser’s experience fully. Go through our detailed guide on how to enable JavaScript on Google Chrome. It covers all that you need to know about completing this process.
Tips for finding and fixing common errors
Check the console for errors – If there are errors in your JavaScript code, they will be displayed in the console.
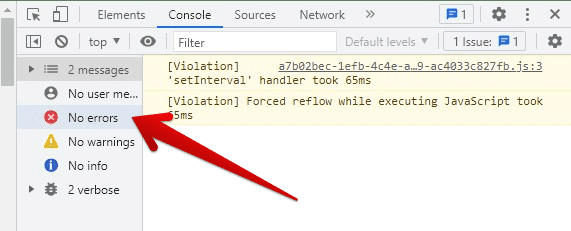
Checking for errors in the DevTools console
Use console.log() – Adding console.log() statements to your code can help you understand how the code is executed and what values are being used.
Check for syntax errors – Syntax errors are common in JavaScript and can be easily fixed by checking for missing or extra parentheses, braces, or semicolons.
Analyzing network activity
The Network tab allows developers to analyze the network activity of a web page, including requests, responses, and loading times.
Step 1: Open the web page you want to analyze in Chrome. Go to DevTools by right-clicking on any part of the web page and selecting “Inspect” or using the keyboard shortcut “Ctrl + Shift + I”.
Step 2: Select the Network tab in DevTools. Reload the web page to capture the network activity.
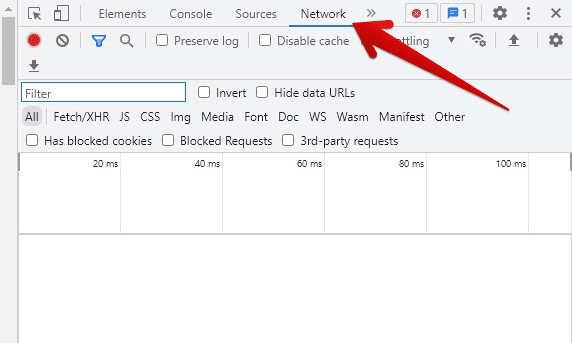
Network tab in Chrome DevTools
In the Network tab, you can see a list of all the requests made by the web page, including the type of request (e.g., GET, POST), the status code (e.g., 200, 404), and the size of the response.
You can click on it in the list to view more details about a request. This will open a panel on the right-hand side of the screen, which displays more information about the request, including the headers, cookies, and timing information.
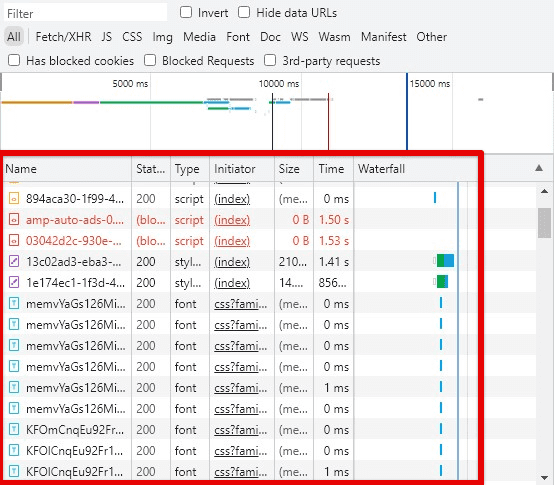
Request list
You can also use the Network tab to analyze the loading times of the web page. This can help identify bottlenecks in the page’s performance.
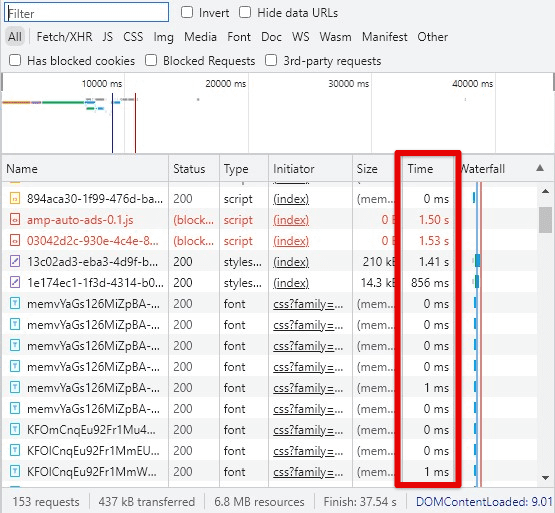
Loading times
To analyze the loading times, you can use the following tools:
Timeline – The timeline shows the duration of each request and the time it took to load the response. This can help you identify which requests are taking the longest to load.
Waterfall – The waterfall shows the order in which requests were made and how long each one took to load. It helps identify which requests are blocking other requests from loading.
Using the Network tab, you can analyze the network activity and identify crucial issues, which can help you optimize the page for better performance.
Performance profiling
The Performance tab allows developers to profile the performance of a web page, such as CPU usage, memory usage, and load times.
Step 1: Open the web page you want to profile in Chrome. Go to DevTools by right-clicking on any part of the web page and selecting “Inspect” or using the keyboard shortcut “Ctrl + Shift + I”.
Step 2: Go to the Performance tab in DevTools.

Performance tab in Chrome DevTools
Step 3: Click the Record button to start profiling the page.
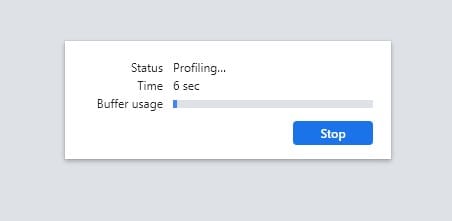
Profiling the web page
Step 4: Interact with the page to simulate user activity. Once finished, click on the Stop button to stop profiling.
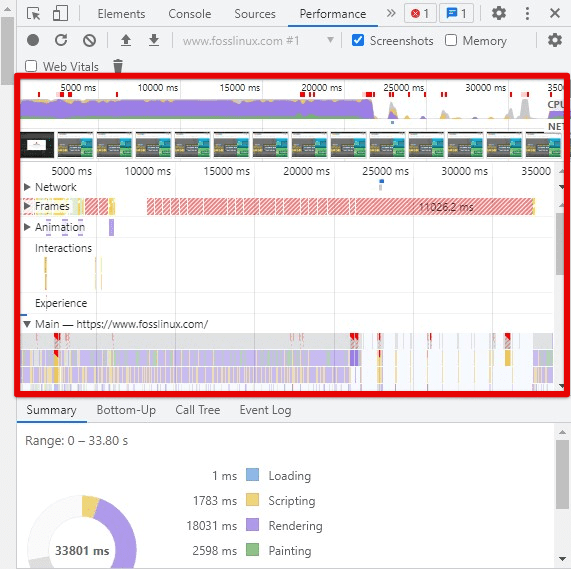
Performance profile
In the Performance tab, you can see a page activity timeline, including JavaScript events, network requests, and rendering activity. To view more details about a specific event, you can click on it in the timeline. This will open a panel on the right-hand side of the screen, displaying additional information. You can also use the Performance tab to identify areas for optimization. For example, if a specific JavaScript event takes a long time to execute, use the timeline to determine which function is causing the delay.
To optimize the performance of a web page, a Flame chart and a Summary are two essential tools that can never be overlooked. The flame chart shows the call stack for a specific event, identifying which functions are causing performance issues. A summary offers an overview of the page’s performance, including the total time it took to load and the time it took to render the page.
Conclusion
Mastering Chrome’s DevTools can significantly enhance developers’ productivity by enabling them to inspect and debug web pages quickly, analyze network activity, and profile performance. This article covered the basics of setting up DevTools, inspecting HTML and CSS, debugging JavaScript, analyzing network activity, and performing profiling.
Using these tips and tricks, developers can quickly identify and fix issues with their web pages, resulting in faster and more efficient web applications. It is an essential skill for any developer looking to create high-quality, optimized pages and sites. So, keep practicing and exploring as much as you can. Have you been trying to learn how to sideload Android apps on your Chromebook without the developer mode enabled? Here’s an in-depth guide on sideloading apps without allowing the dev to mode in ChromeOS.
