Many users, even those somewhat experienced with Chrome’s working, might not know about a secret Google Chrome feature that has managed to help developers immensely with back-end development. Enter Chrome DevTools, a distinct side of the Chrome browser that you might not have even heard of before. This guide will discuss the top 10 things you need to know about Chrome DevTools and experience this browser from a fresher perspective.
10 things about Chrome DevTools that you need to know
The subsections outlined ahead will explain some of the best things you need to know about Chrome DevTools. Make sure to read until the end for the best results.
1. Open Chrome DevTools in multiple ways
Before we tread into anything complicated about the Chrome DevTools feature, it’s essential to know how one can access the functionality in the first place. Quite fortunately, there are multiple ways, not just one, of getting to grips with how you can fire up this novel utility on your end. Let us break the ice and walk you through the three easiest ways to do this.
First off, click on the “Customize and control Google Chrome” button in the top-right section of your browser’s interface. The vertical ellipsis is pretty apparent there, so you shouldn’t be able to miss it. After clicking on it, a list of options will appear in that section. Hover over “More tools” and click “Developer tools” to finalize. This will be one way of getting the job done.
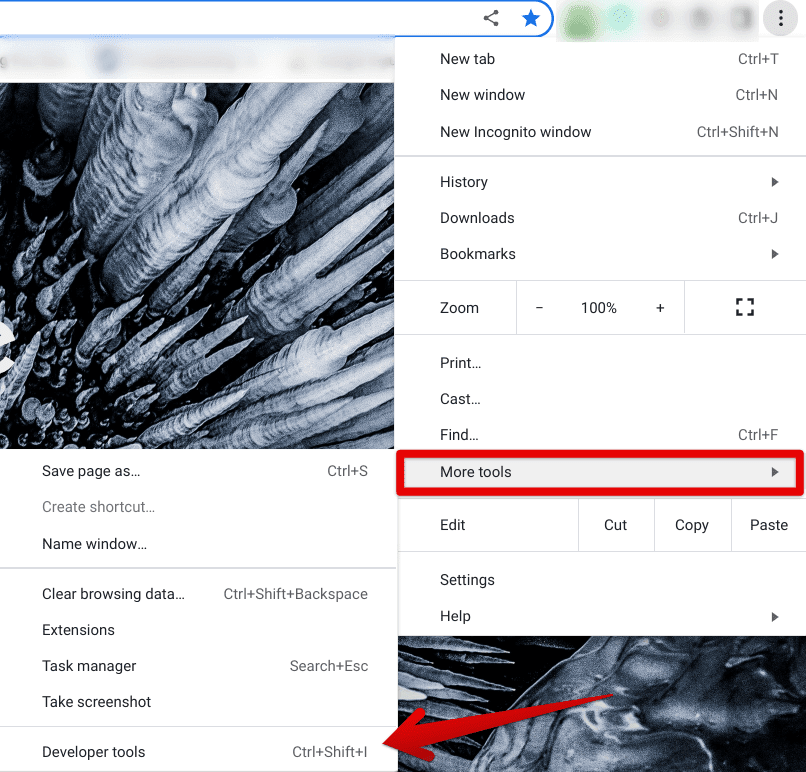
Opening Developer tools in Chrome
That’s just the tip of the iceberg, speaking broadly. The Chrome DevTools offers multiple ways of being opened right from the browser just with the help of some shortcut keys. Let’s enlist these key combinations below and describe what happens when you use them.
- Ctrl + Shift + I: Directly opens the “Inspect element” part of Chrome DevTools
- Ctrl + Shift + J: Directly opens the JavaScript portion of Chrome DevTools
- Ctrl + Shift + C: Directly opens the CSS section of Chrome DevTools
Therefore, each shortcut key combination is built to serve a specific purpose, should you choose to opt for any of them. We suggest continuing to read and learn about these features in case you have little to no prior experience with their usage.
2. Inspect the element
Next up, the “Inspect element” feature is probably the most beginner-friendly part of Chrome’s DevTools. It’s a convenient, goal-oriented tool that boasts several different features. For instance, you can view the CSS code of any web page using this functionality. In addition, using the “Inspect element” tool even lets you perform an in-depth search on any web page, which is much more feature-rich than the usual way of searching for on-page elements.
Not only that, but if you’re a back-end developer whose job revolves around consistent website maintenance and coming up with new ideas for improving your site, element inspection can allow you to make multiple apparent changes to a page’s layout, so you can ascertain how the final finish will look. Added utilities such as these go a long way in providing developers with the ease of access they need to handle their programming endeavors on the fly.
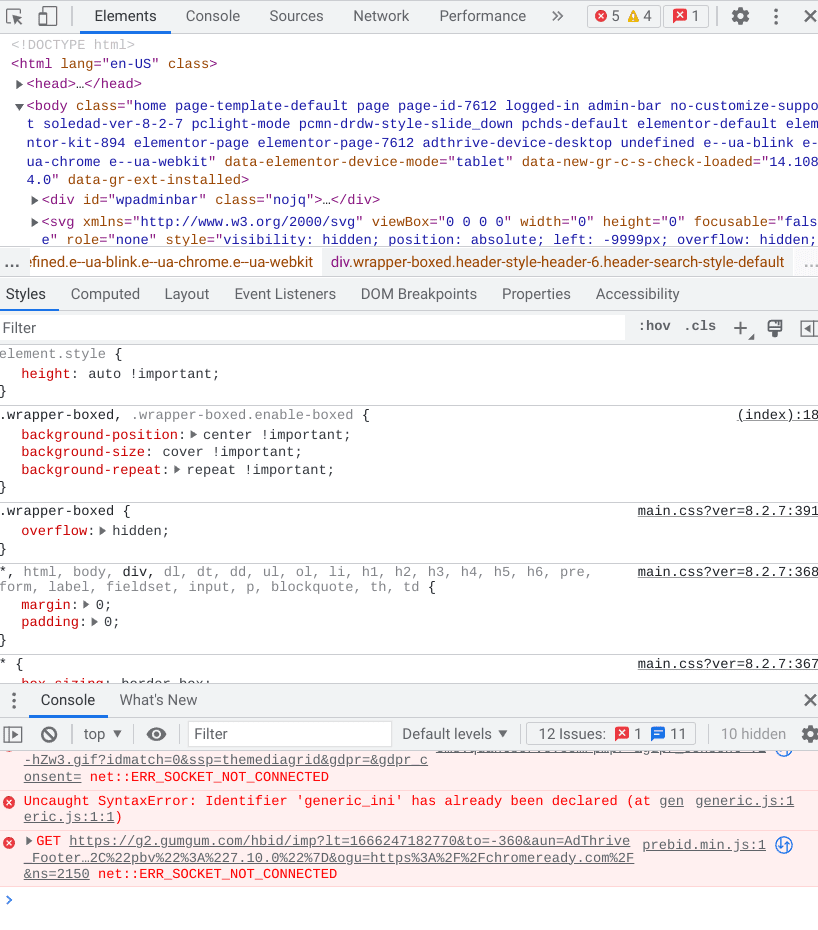
The Inspect tool in full flight
Another prominent feature of the “Inspect element” tool is that it allows one to edit the HTML of various websites, so you can perceive the changes on your end to determine the result right there and then. Moreover, you can experiment with a website’s layout design without going to the back end. All proceedings occur right within the browser thanks to this keen DevTools functionality.
The fact is that we’ve curated a whole article on inspecting elements. So please give it a read to understand the full depth of this functionality and to better learn how to employ the tool’s diversity on your Google Chrome browser.
3. Take screenshots
You might as well know how to take screenshots in the Chrome browser in multiple ways, but you might not know about capturing your screen with the help of Chrome DevTools. That’s right. It’s more than possible to save a copy of your screen in real-time just by making a few clicks within the DevTools section. To get started, press “Ctrl,” “Shift,” and “I” together to open the DevTools portion on your screen.
When you’re done, click on the “Customize and control DevTools” button, as shown in the screenshot below. The option resembles the “Customize and control Google Chrome button” to a reasonable extent, so digging it up shouldn’t be too much of a hassle.
Multiple options appear on the screen, like when you click on the former. Out of the different entries, click on “Run command,” and you will be good to go. The shortcut key combination of “Ctrl,” “Shift,” and “P” will work just fine as well.

Running a command in Chrome DevTools.
After clicking on the “Run command,” a bar will surface on the screen. Here, type in “screenshot,” and all available options will appear on your end for you. Feel free to choose the type of screenshot capture method that would benefit you the most. At present, there are four different options available for end users. These include:
- Capture area screenshot.
- Capture full-size screenshots.
- Capture node screenshot.
- Capture screenshot.
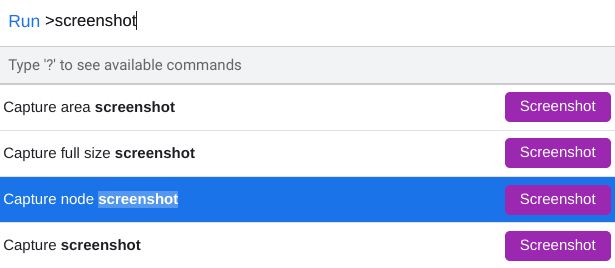
Different ways of taking a screenshot in DevTools
Opting for any of these screenshot-taking methods will bring desirable results. So let’s move on to the next thing you should know about Chrome DevTools.
4. The Framework Ignore List feature
From here on out, we’ll include some tools about Chrome DevTools that relate to developers more than they affect end users. Of course, this is in tandem with the core nature of the Chrome feature we have at hand. Now, the next thing you should know about DevTools is its “Blackboxing” capability which allows specific files to be put under a metaphorical black box so that these files won’t hinder your debugging work.
To initiate this feature, follow the steps in the previous section and get to the “Run command” segment of the Chrome DevTools functionality. To let you in on a shortcut for achieving this, press “Ctrl,” “Shift,” and “I” together within the Chrome browser. Once done, DevTools should pop up. The next step is to press “Ctrl,” “Shift,” and “P” together. That will immediately bring up the “Run command” tool for you without having to delve into extra steps.
As the bar appears on your end, type in “Ignore list,” The following option should appear for you, taking you straight to the “Settings” section of DevTools upon clicking on it. Check out the screenshot below for a visual explanation of how this will be done.

Running the relevant command in DevTools.
Once you’re out and about with the “Framework Ignore List” section, feel free to add the relevant scripts to the black box. To those who know, it’s simply plug-and-play from here on out.

Framework Ignore List
5. Preservation of logs in the console
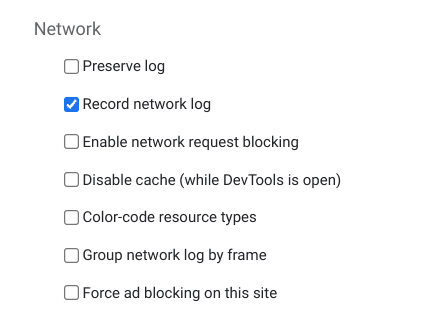
Preserving logs in Chrome DevTools
Moving forward, you should know about the “Preserve log” feature. It’s one of the most convenient tools offered by Chrome DevTools that can make the lives of developers much easier. The primary purpose of this tool is just what its title depicts the functionality to be.
Whenever you’re making changes to any web page in Chrome, but you’re worried that a connection loss or any other hindrance will not let the change take completion, enable the “Preserve log” feature, and your changes will automatically be saved every step of the way. Moreover, this will prevent reloading of your pages from clearing away your changes, so indeed, a win-win situation.
6. Event Listener Breakpoints

Event Listener Breakpoints
Event Listener Breakpoints in Chrome DevTools are another error-preventing measure that allows developers to spot issues more efficiently. It relies on user interactions and allows one to dig up instances of interest, so whenever a faulty interaction occurs in Chrome during development, the source of the matter can be found.
For this, go to the “Sources” section in DevTools and find “Event Listener Breakpoints” there. There will be a whole list of options there, so experiment with different entries to learn the deeper ends of the functionality.
7. Network tab
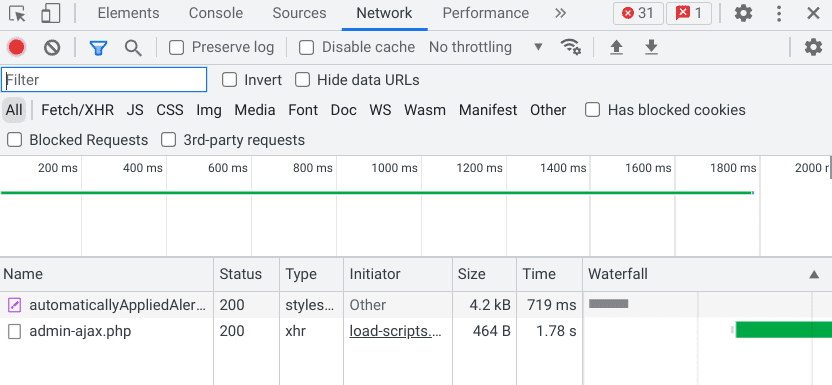
The “Network” tab in DevTools
Moving up, we’ve got the “Network” tab to shed light on here. This particular section is concerned with the various request sent to the user from a website, so you can track the activity of the domain using the “Network” area. For example, when you open the DevTools section, you can click on “Network” to get started. Once done, reload the page so the browser can fetch the relevant source.
Using “Network,” it’s even possible to assess your page’s overall layout and design, not to mention the metrics of “Status,” “Type,” “Initiator,” “Time,” and “Waterfall” to help you get by from the perspective of a developer.
8. Security features
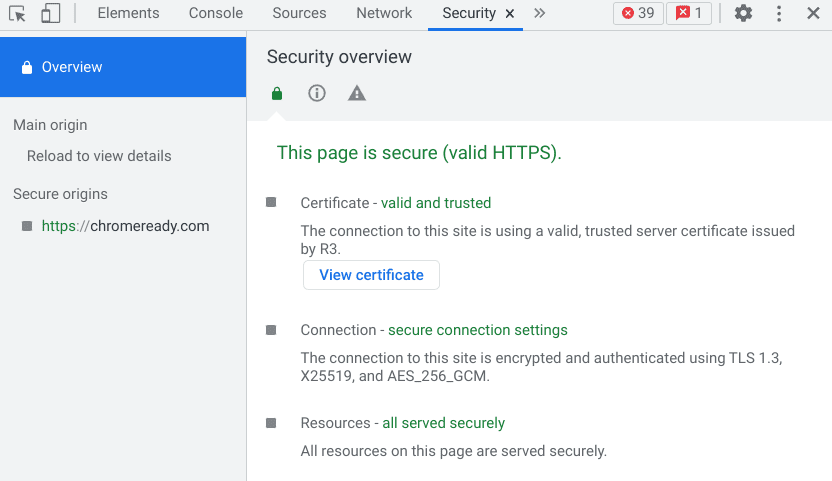
The “Security” tab in DevTools
Chrome DevTools is heavy on security when it comes down to it. However, you can employ the service of this particular functionality to ensure that the HTTPS protocol is under use on a specific web page. Right off the bat, this will set the tone for how you want your browsing experience to be. It’s even possible to check out the SSL certification of the page you’re on to further add to the security verification.
9. Performance tools
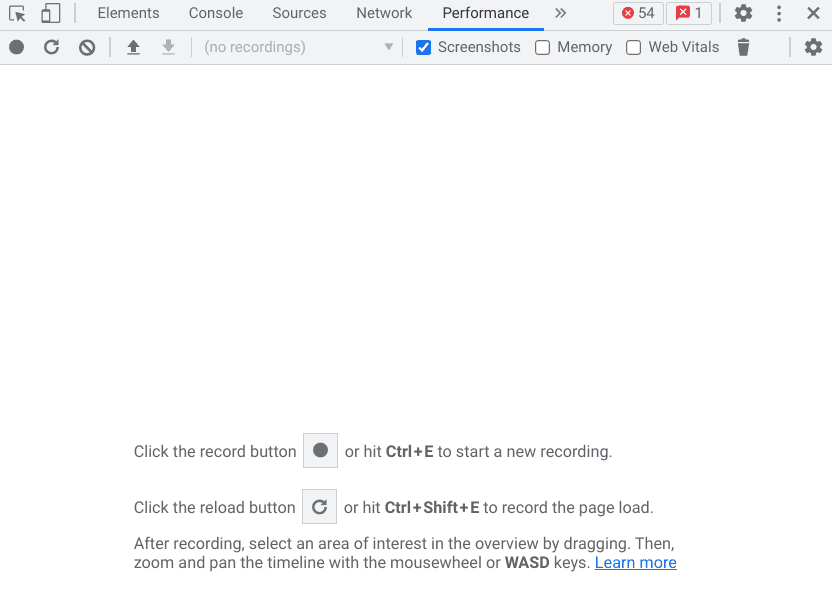
“Performance” in Chrome DevTools
The second-last entry on this list of the top 10 things you should know about Chrome DevTools is how the “Performance” section can be used to analyze the performance analytics of a particular web page without relying on any third-party source. Once you click on the relevant tab, you can use either of the present options, such as starting a new recording and recording the page load to analyze how well or poorly a particular page performs.
It’s tricky to have up your sleeve, especially for developers who need to test websites currently in the developmental phase. DevTools is as advanced as it can be, and thankfully, most of its available utilities are geared toward the exertion of effective website creation on Google Chrome. Let us now look at the tenth and final entry present in this write-up that you should indeed be wary of.
10. Lighthouse report
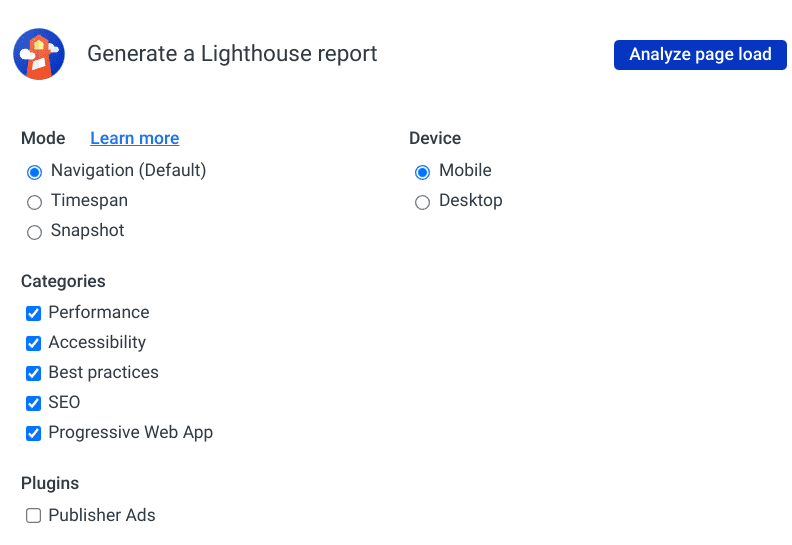
Lighthouse report
Similar to a lighthouse that acts as a guiding beacon for those who get lost at sea, the “Generate a Lighthouse report” functionality in Chrome DevTools is efficient in helping out troubled developers. It’s adept at creating a user report for different metrics of your page, especially the ones that involve the page’s performance, accessibility, best practices, SEO, and PWAs.
There are multiple modes of Lighthouse report generation, such as “Navigation,” “Timespan,” and “Snapshot.” In addition, you can also select the type of device you’re on, whether that’s “Mobile” or “Device.” The Lighthouse report encompasses different variables and presents it to the developer in an easy-to-understand format. It’s a great send-off to the top 10 things you should know about Chrome DevTools that we’ve got here.
Conclusion
Chrome stands tall as a high-performance internet browser with consistent development and evolution. From enabling JavaScript to viewing and updating saved passwords in the famous web surfer, a lot can be accomplished here. Moreover, Chrome isn’t any short on customization features too. You can seamlessly customize the new tab background on Google Chrome with multiple other ways of switching up the browser’s appearance.
That said, Google Chrome isn’t just geared toward everyday use for casual users. It comprises a swath of hidden functionalities and tools that cater to advanced or expert user bases. Relating to the focus of this guide is precisely one such facet of Google Chrome, and it comes under the name of Chrome DevTools. By now, you should clearly see this utility in Chrome in the context of its working capacity.
Do let us know in the comments section ahead whether you imparted useful knowledge from reading about Chrome DevTools through this write-up or not. We would love to read your feedback!
